This section is intended for general users of Dynamic AI. It will focus on how to use already designed reports (for general users). You will find a guide to design new reports (for developers / content creators) in the section “Creating data bound Reports”.
Most examples and screenshots are based on the standard Dynamic Demo which can be installed together with Dynamic AI.
A Dynamic AI Report is a combination of several elements, including rights, design and usually a database connection.
From a users perspective however, it is often just an item on a menu that provides access to content of some kind.
There are several ways of navigating Reports in Dynamic AI.
The most common method to access a Report is through the Report Menu.
The typical grouping of the Report Menu is by owner type (Common / Own), but the menu can also be organized by i.e. “User Group”, “Author”, “Type” or “Connection”. Read more about this in the section “Presentation of Reports menu”.
If your menu is organized by Common / Own and you do not see menu item “Own”, it is because you have not created any Reports.
Note: You might not have permission to create Reports, in which case the menu item Own will not be accessible.
Underneath this top-level of the hierarchy, Reports are always organized by Category followed by Group followed by Report Name. The hierarchy initially appears in a collapsed state. Clicking on an item in the Report Menu expands that level in the hierarchy.
Reports themselves are on the lowest level of the hierarchy. Clicking on a Report name opens the Report in the Presentation Area.
It is possible to filter the Navigation Menu by using the search box placed in the Report Menu. Simply type the keyword you are looking for and press [Enter].
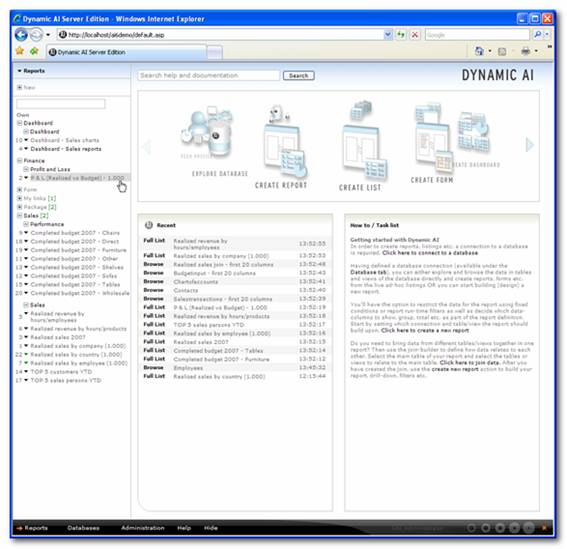
Below screen shot from Dynamic AI shows a Report menu expanded on various levels.

On the top level of the grouping in the Report menu, you might find a number to the right of the category name. This number will in a green color show how many reports that have changed since you last login. In the above example you can see that 2 reports in the category “Sales” have changed since last login.
When the presentation of the Report menu gives the user several groups to look at (i.e. common/own or types) a number will also be shown to the right of that group. In the below example the menu form above has been regrouped to show reports by type:
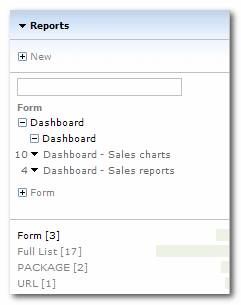
Here you will find the number displaying how many reports included in each group. The number will also be shown graphically by the green bars next to the groups. The group selected (in this case “Form [3]”) will be formatted with black text and the others will be gray to ease the navigation of the menu.
To the left of the report name you might see a number shown. That number will indicate that the report is one of the 25 most used reports in the application. [1] will indicate that it is the most used and [2] means second most used etc.
As described above a single click on the report name will open the report. However there are several other options available. These are reached by clicking on the drop-down icon to the left of the report name as shown below:
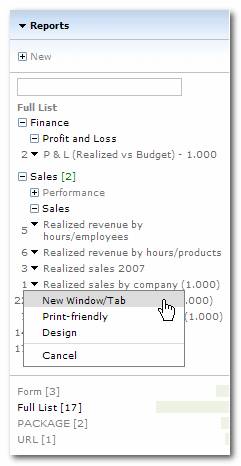
New Window/Tab will open the report in another window allowing you to have several reports open at the same time.
Print-friendly should be used when you want to print the report at this will exclude menus and ensure that the right pane is printed.
Design will open the design module. Read more about this in the section “Creating data bound Reports”
Cancel will close the drop-down menu.
The standard Dynamic AI start page will in the lower left side of the screen show reports run by the user in that specific session. Whenever you want to go to your start page you can click the below icon in the toolbar:
![]()
The recent box on the Dynamic AI start page could look like this:
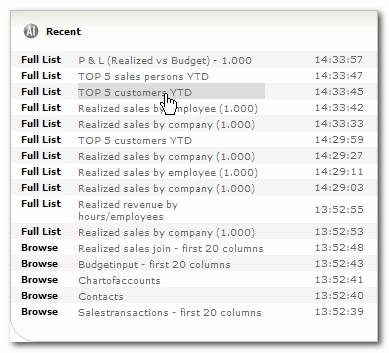
The report shown holds information of type report as well as information of when it was run. Clicking the name of a report will open it.
Another method of finding a Report is through toolbars.
Toolbars are made from a special Report called a “Package”. A Package is a group of Reports that typically are related in some way.
A Report definition can include instructions to
· Leave an existing toolbar alone (do nothing)
· Load a new package as a toolbar (or replace the existing toolbar)
· Clear the toolbar (if any)
The toolbar is displayed in the top of the Dynamic AI screen.
Note: A package can be made from other packages. In this case, the toolbar will show a drop down list with Reports from each package.
By using toolbars, applications can be made that provide an entirely different navigation look.
It is possible to design a freestyle menu by placing items on a blank page. Freestyle menu items can include graphics, custom texts, links to Reports, snapshots of Reports, external web pages, packages and much more.
This type of menu gives the possibility of providing menu structure with a corporate look and feel.
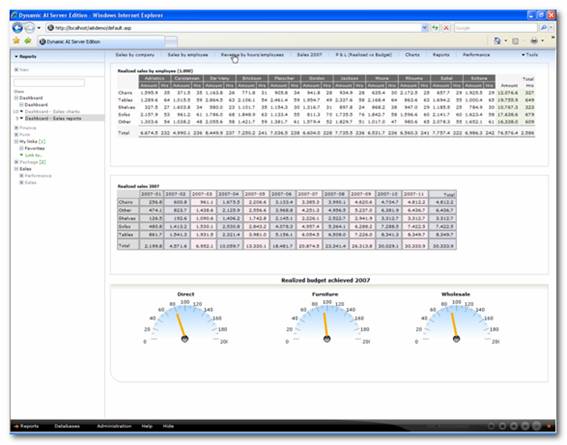
In addition to links to other Reports, the initial view of the Reports can also be part of such a menu. In the example below, a blank page has been fitted with 2 report snapshots, 3 charts and a toolbar.
Note that the data snapshots also work as links to their respective Reports, providing an overview of status as well as a way to quickly view the data itself.
