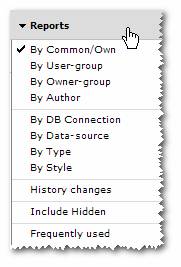
When clicking on the Report Menus header the following possibilities of report presentation will be shown:

Each of them is described below.
The typical grouping of the Navigation Menu is by Common/Own. Reports will be divided into two main groups depending on whether or not the report is shared among several users.
If your menu is organized by Common / Own and you do not see menu item “Own”, it is because you have not created any Reports that isn’t shared.
The Dynamic AI Desktop and Personal Edition will always show reports in common when selecting this kind of presentation, since these editions don’t include user and group functionality.
Note: You might not have permission to create Reports, in which case the menu item Own will not be accessible.
When you present the report menu by user-group the first hierarchy in menu will be the user groups applied to the reports.
Click on the group name in the bottom of the Report menu to shift between the different User-groups.
Note: This setting cannot be used in Dynamic AI Desktop/Personal since these editions don’t include user and group functionality.
When you present the report menu by owner-group the first hierarchy in menu will be the owner groups applied to the reports.
Click on the group name in the bottom of the Report menu to shift between the different Owner-groups.
Note: This setting cannot be used in Dynamic AI Desktop/Personal since these editions don’t include user and group functionality.
When you present the Report menu by Author the first hierarchy in menu will be the Author that originally created the reports.
Click on the Author name in the bottom of the menu to view reports created by another Author.
Note: This setting cannot be used in Dynamic AI Desktop/Personal since these editions don’t include user and group functionality.
If the Report menu is set to be grouped by DB-connection the name of the connection used for the individual report will be used on the first group level.
Click on the names in the bottom of the menu to shift between the DB-connections.
If you decide to group the Report menu by Data-source you can get a good overview of where the data used in the different reports actual comes from.
The first grouping level will be by DB-Connection in the same way as described above. But instead of showing the normal Category and Group hierarchy the next levels will be the name of the table/view that the report is based on and after that the owner group of the report.
When you present the Report menu by type the first group level in the menu will be the type of report. This will give you a fast overview of where to find i.e. Lists, Forms, URLs or Packages in the application.
It is also possible to present the Report menu by style. In that case the reports will be grouped after which style they are presented.
This can be very useful when styles are applied depending on type of business, company, department etc.
The date of report changes can also be used as a parameter for grouping the Report menu logically.
The group order will be year followed by month and date.
Reports can be designed to be hidden from the Navigation menu. That will typically be set on reports that are used in other reports as key value lists.
In order to be able to find and eventually change these reports it’s possible to activate “Include Hidden”. After next menu refresh i.e. by selecting a way to present the Report menu (as described above) the hidden reports will be included in the Report menu.
If you want to have a quick overview of the 25 most used reports activate “Frequently used”. Next time the menu is refreshed it will be filtered to only show the 25 most used reports. The rank is shown to the left of the report number (“1” is the most used report). The rank is calculated based on all users executions, why it might be possible that you won’t find all 25 reports in the menu, unless you have user rights to se them all.
After activating “Frequently used” you can decide how to present these reports in the menu (i.e. by Data-source).