
The key element a Dynamic AI User will work with is the “Report” Element.
A Dynamic AI “Report” is usually thought of as a data bound report design or form, but extends beyond this.
A Dynamic AI Report is better defined as the visual composite of a design (freestyle, tabular or form) combined with style elements and access rights and usually also a connection to a particular table or view and in some cases including other Reports. Thus all Dynamic AI Elements (connections, styles, rights and other Reports) can be part of a Dynamic AI Report.
With Dynamic AI, it is easy to establish new Reports. Reports can in general be grouped by
· Data bound Reports and
· Non-data bound Reports
The individual aspects involved in customizing Reports are detailed in this chapter. The chapter is structured to follow the menu items on the user interface.
After each menu tab an example of the most important features will be set.
The design module can be reached in different ways:
· Select an existing report an select Design in the drop down menu to the left of the report name in the Reports Menu
· Open an existing Report and select ”Design” in the Tools Menu (placed in the upper right of the screen)
· Open an existing Report and select ”as new copy” in the Tools Menu (placed in the upper right of the screen) to create a new report based on the existing one.
· Explore existing databases and select ”Design” in the drop down menu to the left of the table/view name in the Databases Menu
· Selecting new report, list, graph etc. in the Reports Menu. Read more about this starting point for reports in “Reports”
·
When designing a Report you can apply, save or delete the Report:
[Apply] This button applies changes without saving them.
[Save] This button saves the changes made on a Report.
[Save as] This button will insert a new Report.
[Delete] This button will delete the Report.
[Cancel] This button will cancel the customization of the report.
The most important details of the presentation of a Report are defined in the [General] menu item.

Category/Group/Name
The fields Category, Group and Name determine the placement of Report in the Reports Menu. New categories and groups are established simply by typing the new names in these fields. Categories and groups are deleted if they no longer contain Reports.
The menu hierarchy items such as ”Common” and ”Own” have 3 levels in categorizing and grouping:
· Category - the broadest classification of a Report.
· Group - a set of Reports, which are found under one Category
· Name - lists all Reports that are placed in one Group.
The Reports Menu is by default showing the first level of the menu hierarchy, where the possibilities are common/own, user group, owner, author, type, style, database connection and data-source.
By clicking the menu item the Categories in the selected Item is shown. Clicking once on the Category name will allow you to see all the Groups under that Category. A single click on a Group name will then allow you to see the Reports saved in that Group.
Options
A Report can be presented in six different ways, which are described below.
Choose this type of presentation when you want to join a grouped list by a business graphic or chart.
When choosing “Report” or “Graph only” the General menu item is expanded to show following possibilities of defining the business graphics

It is possible to choose between several types of graph templates. New templates can be added. The following types of templates are included in a standard Dynamic AI installation:
· Areas
· Bars
· Pies
· Lines
· Gauge
When presenting a Report as a pivot table/cross tab table (see List section) it’s possible to select which data to be included in the business graphics:
·
X-axis=columns values=totals
The column grouping defines the x-axis and totals of these groups are shown in
the graph
·
X-axis=rows values=totals
The row grouping defines the x-axis and totals of these groups are shown in the
graph.
·
X-axis=columns values=rows
The column grouping defines the x-axis and the row groupings are presented as
series
·
X-axis=rows values=columns
The row grouping defines the x-axis and the column groupings are presented as
series
When a Report is presented as a list, all the records are shown on a list. Choose this type of presentation when you wish to group your data.
Dynamic AI is set up to present the first 300 records at the detail level. Therefore it is not possible to erroneously establish Reports with millions of records, which needlessly strain the server. It is possible to change this 300-record limit, read more about this in the section regarding ”Options”.
It is also possible to select a record within a list and show it as a form.
If only a business graphic from a list is to be presented, this type of presentation is useful.
The Report settings regarding presentation of the business graph are the same as described above.
When a Report is presented as a scrollable list, the user will be shown the first 20 records in a table/view, with the possibility of scrolling back and forth. The default number of records shown on each page can be set under the “Options” tab, but can also be set by the user when working with the Report.
This type of presentation is convenient when working with lists that are very long. By using search and filter functions, the user can easily find relevant records.
It is also possible to select a record within a list and show it as a form by clicking the button to the left of the record.
Use this type to create lists that can be used for interface/export options. Read more about this in “Tools”.
When a Report is presented as a form, each record is shown separately. The advantage of this type of presentation is the dynamic layout possibilities for setting up forms, and the possibility to see all fields on a record at once.
The tabs associated with customizing lists are automatically hidden when this presentation type is chosen.
You can decide if a user will be able to drill down to a form level in the Report you establish.
The drill-down to the Reports own form option is activated by default. You will be able to choose drill-down to a list/form from a related Report.
In order to drill-down to another Report, a relation must already be defined between the data sources that the two Reports are based on. This is described in details in “Relationship definition”.
In this way, it is possible to link easily from one Report to another.
If there are several Reports based on the same table/view, one form layout can be used for any or all of the other Reports. It is not necessary to design a new form each time a new Report is established.
This is useful in many instances. For example when balance sheet, profit and loss and budget data are derived from the same table, only one form layout is needed to present transaction specifications.
User permissions – or access rights on a Report is set under the Rights tab.
It is the original Author who first decides who gets which permissions on the Report.
Once you grant rights to a user group for your Report, they will automatically get a shortcut to the Report displayed in their navigation menu (next time they login).
It is possible for you to make another user group ”owner” of your Report. Once you do this, the owner can make changes or even delete the Report.
Main access and design rights
This is where you define which user group that has user access to the Report and which group that has ownership access.
Individual user rights are set below.
Note: Once you grant ownership rights to others, they can modify and even delete your Report. They can also change the Report so you do not have access to it anymore.
If other users need access, you must create a user group, unless there is already an appropriate group created. Creating user groups is described in detail in “”. Select the name of the group from the drop down list.
To keep the Report private, select your own username from the list.
Depending on the specific user’s role (user, author or owner) it might be required to add a sub-share user group when inserting a new report.
Sub-sharing has been implemented in order to avoid users to design a Report from 1 user group and insert the Report into another local group where members not necessarily have been members of the original intended user group of that particular Report. When a user is not part of the OWNER group of a Report - then a SUBSHARE (an additional user group to the original) must be specified. In that way Dynamic AI will validate that the new Report may only be used by users of the original intended user group in combination with the newly specified SUBSHARE group (or the author himself).
Use of sub-shares is a great opportunity to decentralize the developing of reports!
Below is a matrix showing that if the user of quick customization isn’t owner of the report a sub share is required. It’s also notable that a user cannot update or delete a report without being a part of the owner group or the author.
|
|
User |
Author |
Owner |
|
Update |
NO |
YES |
YES |
|
Insert |
YES, with required sub user group |
YES, with required sub user group |
YES, with option to set sub user group |
|
Delete |
NO |
YES |
YES |
The user or group of users that are owners of a Report will always have all access rights for the Report.
If you choose to let other users or groups be owners, they will also be able to administer access rights, including revoking your access.
If you want to be the only user with owner rights, select your own username from the drop down list.
Change History and saved versions
Every
time a Report is changed and saved the old definition of the reports is saved
by Dynamic AI. The definition of the reports can be displayed by clicking the ![]() to the
left of the version. This will display the Summary Info
to the
left of the version. This will display the Summary Info

If any changes have been made in design mode the changes can be verified in the summary document, were current and saved definitions are compared.
It is possible to reload an earlier version of the report by clicking reload in the general tab.
General, examples
The following example is based on a simple employee table selected trough “Explore connections”
The Category, Group and Report is by default set to
My Reports
The name of the Connection
The name of the data source (table, view etc.)
This naming is easily changed and by clicking [Save] in the bottom of the screen, the Report is saved. Clicking on the Report name in the Reports menu then opens the Report.


Because the Report was set to open as a scrollable list, only the first 20 records of the table are shown. By using the Action buttons it is possible to scroll and search trough the data:

Under this tab, the main decisions of the list are made; including which fields will be included, grouped, filtered and calculated. Below is an example of the “List” screen:

Available fields
The “Available fields” box shows all the fields included in the table/view. From here its possible to select the fields and move them into Groups, Totals, Details or Filters.
If new fields are added later to the underlying table/view, these fields will automatically be shown in the “Available fields” box. In this way new fields won’t interrupt with original Report definitions.
By clicking on the different tabs you can select which field handling to work with. I.e. if you wish to define fields that should be filtered you need to click on Filters before adding the fields. It is also possible to change between the types simply by right clicking inside the “Available fields” box.
The easiest way to toggle between Groups, Totals, Details and Filters is by right clicking inside the “Available fields” box.
When moving field names into the different types of field handling you can use the [Add] and [Del] buttons after you have selected which fields to move. It is also possible to add fields simply by double clicking the field name in the “Available fields” box.
The easiest way to move fields from Available fields into Groups, Totals, Details and Filters is by double clicking the field name in the “Available fields” box.
Fields used in the Report are marked with a gray color under available fields, which makes it easy to clarify the fields used the Report.
The columns/Fields can be shown in original order (default) or sorted in alphabetical order and grouped into the types of field i.e. integer, date, text fields etc. (A-Z).
In the search box next to sorting checkbox it is possible to search for specific field names. Be aware that this search is case sensitive.
By clicking “Use format document for selecting and formatting available fields” it’s possible to paste definitions directly to dynamic using “Cobol format”.
Any virtual columns (SQL Vars) that are available to use on the specific Report or data source will be shown as “Available Virtual columns” in the button of the Available fields list.
These fields can be used as any other available field, but will only affect the sql-statement sent to the server when actually used.
Details
Fields listed in this box will be shown in the table at the detail level. A field can be shown at detail level and grouped, calculated or filtered at the same time.
The first 20 fields in the table/view, which the Report is based on, are by default listed in the box ”Details”. Those other fields that you wish to present on the list must be marked and moved from the “Available fields” to the ”Selected fields” box by selecting Details and clicking [Add] or simply double clicking the field name. Fields can be removed by clicking [Del].
The order in which the fields are listed is also the order in which the columns titles are presented at the top of the list.
Use the [Up] and [Down] arrows to the left of the box to change the order.
By double clicking a field that has been included as details it’s possible to change sorting (none, A-Z, Z-A). This can also be set by clicking the field and choosing sorting order below the “details box”.
The table preview in the lower half of the screen shows how the Report will be presented when saving the Report. It is dynamically updated with all changes, which is a great help during the customization.
By grouping data columns it’s possible to create Reports with collapse/expand functionality. By this is meant that it’s possible for the user of the Report to click on a group level to get a specification of the selected group.
From the list of “Available fields” you can decide which fields the list shall be grouped by. Those fields that you wish to group must be marked and moved to the “Groups” box using the [Add] to the left of the “Groups” box or simply by double clicking on the fieldnames in the “Available fields” box.
If you also want to present the fields on detail level, then move them from “Available fields” to “Details”.
There will usually be several fields that are relevant to group by, which is why the order is especially important.
The topmost field will form the first grouping level, followed by the subsequent fields from the list.
Simply pressing the [Up] and [Down] buttons to the left of the “Groups” box will change the grouping order, which also is shown in the table preview. Note that the preview always is shown expanded, with all details.
When you group on more than two fields a “Level break” is automatically inserted after every two groupers. This level hierarchy is used to determine if the next detail level is opened as a “new Report” under the original. This can be useful in situations where you want to move between the detail-levels, or if you want to look at the details while keeping the overview.
The levels can be moved up and down in the same way as the data fields.
It is possible to work with up to 10 levels. Using hierarchies also reduces the server load, as each list is smaller.
Once you create more than one list level, Dynamic AI will automatically create the necessary drill down links on the calculated fields. It is necessary that at least one data-column is calculated.
By double clicking the groupers it’s possible to toggling between row grouping (blank), Column grouping and caption. These setting can also be defined by selecting the grouper and selecting the type below the “Groups-box”.
When Column grouping is selected, every unique value from the chosen field will be represented in its own column with its own column total. This format is typically used to present overviews by department, product, product group, month, quarter, year etc.
Column grouping might (depending on the data) create a very wide list. In such cases it’s recommended to group in rows and use the list hierarchy feature.
Column grouping are used to create “pivot tables”/ “cross tab tables” and another row grouper on the same level is therefore necessary.
Caption is used to combine the field with the row grouped field defined just above. This should only be used when having a one-one relation between the data in the fields.
This could be relevant if grouping on account number and account name, or other fields that “comes in pairs”. If you show account name with account number, you’ll get a list, correctly sorted on account number, but showing the account name on the same level.
More information regarding grouping in columns/rows is given in the section labeled ”List options”.
When activated the details will be shown on a new list. Otherwise they will be shown together with the lowest row grouper.
Totals
By calculating fields it’s possible to summarize or count values/units.
From the list of “Available fields” you can choose those fields that are relevant to calculate on.
The type of calculation is set by double clicking the field and toggling between “Sum”, “Count”, “Average”, “Max”, “Min”, “Std” (standard deviation) and “Var” (Variance) or simply by selecting the type below the “Totals-box”.
In this way you can create Reports with drill down functionality, where the user by clicking on the calculated value opens next level of the Report and get a specification of the value, see section “Locating reports”.
Under the tab ”List options”, you can find more information regarding calculations.
Filters
By filtering data columns it’s possible to create Reports where the user set the filter value when working with the Report. In this way it’s possible to create Reports, where the user actual defines what to see.
From the list of “Available fields” you can choose those fields that are to be filtered. The type of the filter is by default set as a “Free Search” filter. By double clicking the field it is possible to change the filter to a “between” filter, where the user can type “from” and “to” values.
Under the tab “List options”, you can specify if the filter will be based on selection, free text, comparison, etc.
Auto preview
This option is checked by default. It provides a preview of the list as you are working. This gives you a good opportunity to see if the changes you make have the desired effect. The width, alignment and type changes are not reflected. Please update and open the Report to see the effects.
Preview can be seen in html, csv, fixed and xml formats which is done by checking next to the format that should be displayed.
SQL
To view the exact SQL statement that the report is based on check the SQL checkbox and the SQL statement will now be presented below the report itself in the preview.
Style
A Report can be presented using any of Dynamic AI’s standard formats or using a user-defined format, which is discussed in the “Style maintenance”. In this way, one department, one team, or one company can achieve unity and consistency in the appearance of its Reports.
Dynamic AI automatically suggests the style, which is chosen as the standard style for the database link. If another style must be used, simply choose this other style from the list of possible styles.
Width
Here you can adjust the width of your presentation on the screen. State the width in either percent (e.g. 120%) or pixels (e.g. 600px). If no unit is set, Dynamic AI will by default use pixels as type.
Alignment
Here you can decide if the presentation will be right aligned, left aligned or centered.
Type
In this field you can decide if the presentation layout will be as a regular table (default) or as a report. As a report, the company/department/area name and logo can be shown at the top of the screen, while at the bottom of the Report the date and user of the Report can be seen. This is relevant when printing or copying the Report/report.
List, examples
The following examples are based on the Report presenting an employee table, which was created and described under “General, examples”.
Under General the Report type is changed to “List” because the Report must present all the records grouped in different ways.
The data columns in the table are by default placed in the box “Selected data-columns” as shown below and the Report is going to be presented as showed in the Auto-Preview in the lower half of the screen.

By double clicking on [Empl_Country] and [DepartmentName] a grouping of the table is made.
The first group level is [Empl_Country] and the next is [DepartmentName] and in the Auto-Preview it’s possible to see the consequences of the grouping.

After updating the Report by clicking [Save] the result of the presentation is as shown below.

When clicking on a group (e.g. DK), the existing Departments is shown (e.g. Accounting, Production and Support). By clicking on the Department name it’s possible to see the employees included in the group as shown below:

In this way a Report with collapse/expand functionality has been created.
Sometimes it can be useful to calculate totals on Reports.
In this case a counting of the number of employees allocated to each country and department can be useful information.
When calculating on data columns defined as Integers, Dynamic AI will by default summarize the values. If you decide to calculate on other type of fields, Dynamic AI will count the records. This default setting can be changed by double clicking the field to toggle between “Sum”, “Count” and “Average”.
In the following example [EmployeeID] is moved to the “Calculate on” box and defined as a “Count”. The easiest way to do this is to right click on employeeID to change the tab to “Totals” and then double click to move the field into “Totals”. To change the calculation method from default double click on [EmployeeID] in the “Totals” until “…Count” is presented next to it.

After updating the Report by clicking [Save] the result will look as shown below:

It’s now possible to see how the 45 employees are grouped by country and department.
By using filter boxes it’s possible to give the user of the Reports right to define which information to be presented.
In the following example filter boxes for [Empl_Country] and [DepartmentName] is created. This is done by double clicking in the “Available fields” until the tab next to it change focus into “Filters”. Hereafter simply double click on the fields that’s should be applied as filters ([Empl_Country] and [DepartmentName]).

After an update by clicking [Save] the Report will be presented as shown below. It’s now possible for the user to write anything in the search boxes. E.g. write “Mana*” in the department filter and press [Go]. All employees working in departments starting with “Mana” is then presented.

Instead of grouping Country and Department in rows, it is also possible to create pivot tables (or cross tab tables) simply by double clicking the field that should be grouped in columns.
In the example below Empl_Country is grouped in columns.

The result of the above made settings is shown below:

As in a normal row grouping Report, it’s possible to click on the values to see a specification.
Another way of grouping the data is by working with several List hierarchies. This is also a good way of speed optimizing a Report, because the Dynamic AI server will not generate the needed specification for the next List hierarchy before the user actual “ask for it” by clicking the value.
In the example shown below Country is set as list hierarchy 0 and Department as level 1, by moving the level break between those fields.

This change results in a grouping by Empl_Country, and an afterwards specification by Department when clicking on a Empl_Country value, which is shown below:

Note that the specification of employees grouped in different departments in “GE” is generated at the time of clicking “4” next to “GE”.
Because “Detail records on own listing” was checked the employe details will be shown in a separate list when clicking a total, i.e. next to “Sales”:

The content of this tab is generated based on your previous choices on the “List” tab. The options for list details and grouped data columns will only be presented if grouping columns have been selected on the “List” tab. This goes for calculated totals, filters and data columns on the detail level too.
Based on the Report made in the above examples the List options will be presented as shown below.

Grouped data-columns
For each field for which grouping has been chosen, the following set of properties exists. Refer to the screen shot above.
This is the field name as stored in the database.
This field defaults to the field name from the database. However if underscore (“_”) is used in the database it will automatically be changed to a space (see “Empl_Country” above). And if the field includes capital letters in the name a space will be inserted in front of each capital letter (see “DepartmentName” above).
You can change the caption of the column. The entered caption will show on lists.
Note that nothing is changed in the database itself.
It’s possible to change the formatting of the field presentation depending on the type of field.
Text:
Trim Returns a string with no leading or trailing spaces
Ltrim Returns a string with no leading spaces
Rtrim Returns a string with no trailing spaces
Upper Returns a string presented in upper case
Lower Returns a string presented in lower case
Length Returns the number of characters in the string
Mid functionality can be used to only group on a specific part of a string, by defining Mid(x, y), where x defines from where to read, and y defines how many characters to read. It’s possible to use “l” and “r” in order to read from left or right and “0” to use the functionality as a LEFT function.
Integer/Number:
ABS Returns the absolute value of a number.
-1* Multiply the integer/number with -1
Integer Presents a Number as an integer
Implied dec Removes decimals when presenting a number in csv, fixed and xml format.
Date:
When working with dates it possible to present only a part of the date (i.e. the year) or format the date in a specific way (i.e. Month mm+Name which will show the month number and name).
This functionality is very useful when grouping on dates and creating trend analyses.
You can state the sorting order (ascending or descending) of row-grouped values.
A field can be grouped into rows or columns. The default group form is row grouping.
More information regarding grouping in is given in the section labeled “List”.
The list hierarchy is used to determine if the next detail level is opened as a new Report under the original. This can be useful in situations where you want to move between the detail-levels, or if you want to look at the details while keeping the overview.
It is possible to work with up to 10 list levels. Using list hierarchies also reduces the server load, as each list is smaller.
Once you create more than one list level, Dynamic AI will automatically create the necessary drill down links on the calculated fields. It is necessary that at least one data-column is calculated.
The “Show With” function lets you show row groups together.
If you have 2 row groups, but want to drill down using one click instead of two, you can merge the fields.
Please see the section labeled “List” for more information regarding this.
In this column it is possible to select which row groupers that should be printed on new pages (page break before next row grouper). This feature only works with Internet Explore 5.5 or higher.
If the data which you group by includes some kind of numbering or information used for sorting, which you don’t want to be shown in the Report, it’s possible to set the number of leftmost characters to be hidden.
The subtotal feature is another way of row grouping the data. Instead of showing the group total, accumulated totals is calculated and integrated on the list. This feature can e.g. be useful when setting op profit and loss Reports where a summarization showing Gross margin, Earnings before depreciation, Earnings before tax is preferred.
When activated the details will be shown on a new list. Otherwise they will be shown together with the lowest row grouper. Note that a Pivot table always will have this setting activated.
It is possible to show column headers on row groupers in tables, which are only grouped by rows, by choosing it on this list options tab.
An option to allow GROUPS on reports and listings ONLY to show Subtotal part (Hide group header) has been added.
The option is an extension to the “Sub only” flag – which by default accumulate subtotals (as well as hiding the group header). Using the “Subtotal only=Footer only” option will eliminate the accumulation and act as a normal subtotal in Dynamic AI.
Calculated totals
Under this heading, you can set properties for columns marked as calculated.
This is the field name as stored in the database.
This field defaults to the field name from the database. However if underscore (“_”) is used in the database it will automatically be changed to a space. And if the field includes capital letters in the name a space will be inserted in front of each capital letter.
You can change the caption of the column. The entered caption will show on lists.
Note that nothing is changed in the database itself.
It’s possible to change the formatting of the field presentation depending on the type of field.
Integer/Number:
ABS Returns the absolute value of a number.
-1* Multiply the integer/number with -1
Integer Presents a Number as an integer
Implied dec Removes decimals when presenting a number in csv, fixed and xml format.
Values are divided by the value set in this field. This is useful if you want to display the data in a different unit (such as millions instead of thousands).
State the desired number of decimals the calculated value will be displayed with.
Set the calculation you wish for the field. You can choose between Sum, Average and Count. If the data source is a SQL server it is also possible to Count Distinct.
In this combo-box, you can add extra calculations for calculated fields. You can choose from “Running Sum” or “Prct Of Total”
“Running Sum” gives you an extra column to the right of the calculated field showing an accumulated sum. This is relevant for instance when presenting transactions. You can choose to reset the running sum after a change of group by choosing it after the screen has been updated in the selector “Reset Running sum at group”.
“Prct Of Total” gives you an extra column to the right of the calculated field showing the size of the current group relative to the total.
You can state the sorting order (ascending or descending) of calculated values.
When working with advanced list where new columns are calculated based on other calculated columns, it can be useful to hide the information, which the new column is based on.
By checking this feature, the field won’t be presented as a calculation in the Report.
Here you can adjust the width of your presentation on the screen. State the width in pixels.
Other field calculation functions
Apart from the field specific functions, you can set a number of general settings for the Report.
You can choose to limit the number of records you want your Report to display.
This is done by entering a value in the provided field. Entering 5 or 10 will show a list of the first 5 or 10 records that meet the criteria.
Example: If you define descending sort on the ”Amount” field and set the Top X field to 10, you will get a list of the 10 largest amounts from the data source.
This functionality is relevant to pivot-tables. When activated, an extra data row with accumulated totals is presented.
This functionality can be used when working with pivot-tables. You can let Dynamic AI show aggregated values instead of the single group calculated total. When used that means that the values in column group 2 is a summarization of group 1 and 2, and group 3 will be showed as the summarization of group 1, 2 and 3 etc.
Same as “Aggregate values across columns”, except the aggregated value is shown in note form, when hovering the mouse over a number.
If both aggregate options are checked, the net value will be shown in note form.
By checking this option, the total for a column is suppressed. You might want to do that when the fields grouped by give meaningless totals or when using the feature “Aggregate values across columns” since the total and the value in the last group will be the same.
This feature hides the calculated total on rows. This is useful when working with subtotals or running sums since the values will be the same.
When choosing this feature it is possible for the user to drill down from empty cells. That means cells that don’t have any underlying records. This feature is only useful if the Report gives the user right to append new records with list editing.
When working with a Report based on data sources with many records, it can be useful to restrict the user to only drill down on the last row grouper. That means that it is impossible to drill down on totals. This way clicking on “huge” totals won’t generate long lists that can be difficult to read and the user will always see all group levels/specifications.
Sometimes, when grouping transactions, the sum of the transactions is 0 (zero). These groups can be kept from being displayed by checking this option.
When working with different group hierarchies the data in the grouping will sometimes be alike.
If this feature is checked, Dynamic AI will not present a group specification if the underlying data is the same as the first grouper. In this case Dynamic AI will make a drill down to detail level of the Report.
It’s a condition that all subsequently row groupers (name) are Null or all subsequently row groupers (name) have the same value as the previous one.
Conditional Formatting
All values less than value 1 will be formatted with the color that applies to style sheet class VR1
All values greater than value 1 and lesser than Value 2 will be formatted with the color that applies to style sheet class VR2.
All values greater than value 2 will be formatted with the color that applies to style sheet class VR3.
Filters
You can set properties for any field marked as Filtered. The options are described below.
This is the field name as stored in the database.
This field defaults to the field name from the database. However if underscore (“_”) is used in the database it will automatically be changed to a space. And if the field includes capital letters in the name a space will be inserted in front of each capital letter.
You can change the caption of the column. The entered caption will show on lists.
Note that nothing is changed in the database itself.
It’s possible to change the formatting of the field presentation depending on the type of field.
Text:
Trim Returns a string with no leading or trailing spaces
Ltrim Returns a string with no leading spaces
Rtrim Returns a string with no trailing spaces
Upper Returns a string presented in upper case
Lower Returns a string presented in lower case
Length Returns the number af characters in the string
Mid functionality can be used to only group on a specific part of a string, by defining Mid(x, y), where x defines from where to read, and y defines how many characters to read. It’s possible to use “l” and “r” in order to read from left or right and “0” to use the functionality as a LEFT function.
Integer/Number:
ABS Returns the absolute value of a number.
-1* Multiply the integer/number with -1
Integer Presents a Number as an integer
Implied dec Removes decimals when presenting a number in csv, fixed and xml format.
Date:
When working with dates it possible to present only a part of the date (i.e. the year) or format the date in a specific way (i.e. Month mm+Name which will show the month number and name).
The chosen filter can have different purpose. You can choose between compare filters, select filters and free search filters.
This filter lets you compare data.
By setting up this type of filter, you can compare anything you want, such as periods, employee performance, departments, geographical regions or dates.
This feature creates two drop down lists with the possible values to compare based on the data represented in the data source. That is if no key value list has been defined. The use of Key value lists is explained separately below.
It creates a single drop down list, populated with all possible values. It’s possible to choose from all values represent in the data source, unless a key value list has been chosen.
It is also possible to select ”*”, representing any value.
When choosing a compare filter or a select filter Dynamic AI automatically looks for a default key value lists to use in the filter box. The administrator sets these default key lists as “dictionaries”. The use of dictionary is described in details in the “Dictionary maintenance”.
If no default key value list is set Dynamic AI will scan the field in the entire data source for possible values and display these in a drop down list.
On large record sets this can be a slow way to execute a Report. Instead of scanning the whole record set for different keys, you can force Dynamic AI to look in other Reports, and use data from these as key values.
By using the search options it easy to find the right Report to use as a key value list. Simply enter a part of the name of the Report you are looking for and press Enter. The drop down box will be filled with every Report that meets the search values.
When a Report has been selected default values will be set in the next two drop down lists, which are “Value” and “Display as”. The default values are automatically chosen as the first and second data column in the selected Report. It is possible to change these if other values should be used.
In the check box field “Disable * wildcard” it is possible to disable the use of * as wildcard in that particular filter box.
By using the display as you can also store a reference to another Report. For example: If a text field can hold country codes in the form AUS, US, UK, GER etc, you can force users to select from a value list of valid country codes, and additionally help users by showing the display as list with the full country names instead of the abbreviations.
When using a key value list to populate filter boxes in different Reports, the value selected in one will also automatically be selected when opening other Reports using the same key list.
You can state the sorting order (ascending or descending) of the values in a drop down list.
This type of filter is set as default and will give the user a text box, where she can enter any filter criteria. By default the filter will be unrestricted when opening the Report.
“*” is used to make filter on values that is like the written one. For example when filtering on months you could write “Ju*” and automatically June and July will be used as filters.
In this field it is possible to select whether an entry different from “*” in the filter box or free search field is mandatory.
When disabling the possibility to use wild cards in the search the report will only be executed on the exact naming typed in the free search filter.
You can assign ”=”, ”>=”, ”<=” or “between” as the filter operator. This enables Reports filtered on intervals, for instance showing transactions greater or smaller than a given value.
Auto-Preview
This option is checked by default. It provides a preview of the list as you are working. This gives you a good opportunity to see if the changes you make have the desired effect.
It’s possible to see the preview in HTML, CSV, FIX and XML format. By checking “SLQ” the SQL-statement that the report is based on will be shown below of the report.
Detail level data-columns and export to CSV, Fixed Length and XML files
All values selected to be shown at detail level are formatted in the lower section of the list options tab.
You can set different properties for these details as described below.
This is the field name as stored in the database.
This field defaults to the field name from the database. However if underscore (“_”) is used in the database it will automatically be changed to a space. And if the field includes capital letters in the name a space will be inserted in front of each capital letter.
You can change the caption of the field. The entered caption will show on both lists and forms.
Note that nothing is changed in the database itself.
When working with the Dynamic AI Dictionary it is possible to make global changes of field captions. In this way the maintenance of Report captions can be minimized. Read more about Dynamic AI Dictionary in the “Dictionary maintenance”.
It’s possible to change the formatting of the field presentation depending on the type of field.
Text:
Trim Returns a string with no leading or trailing spaces
Ltrim Returns a string with no leading spaces
Rtrim Returns a string with no trailing spaces
Upper Returns a string presented in upper case
Lower Returns a string presented in lower case
Length Returns the number af characters in the string
Mid functionality can be used to only group on a specific part of a string, by defining Mid(x, y), where x defines from where to read, and y defines how many characters to read. It’s possible to use “l” and “r” in order to read from left or right and “0” to use the functionality as a LEFT function.
Integer/Number:
ABS Returns the absolute value of a number.
-1* Multiply the integer/number with -1
Integer Presents a Number as an integer
Implied dec Removes decimals when presenting a number in csv, fixed and xml format.
Date:
When working with dates it possible to present only a part of the date (i.e. the year) or format the date in a specific way (i.e. Month mm+Name which will show the month number and name).
Values are divided by the value set in this field. This is useful if you want to display the data in a different unit (such as millions instead of thousands).
State the desired number of decimals the calculated value will be displayed with.
Controls sorting, column width and text wrap options. When not explicitly set, the displayed values will not wrap, and the columns displayed will be as wide as the widest data currently displayed. Long text fields can make the list very wide and as such difficult to read.
You can state the sorting order (ascending or descending) of the values.
Here you can adjust the width of your presentation on the screen. State the width in pixels.
If a list or field is too wide, you can check the “Wrap text” box. Dynamic AI will attempt to fit the list to the screen width, by assigning more lines for the field.
Below settings only have effect on Fixed Length Files format. Different kind of trailing can be set by selecting Trailing type:
Cxxx Inserts a custom Char in front of value
CCCxxx Inserts custom Chars in front of value, to “fill up” defined Output Length
xxxC Inserts a custom Char behind the value
xxxCCC Inserts custom Chars behind the value, to “fill up” defined Output Length
Align Right Will align the value to the right
Align Left Will align the value to the left
Prefix 0s Will insert 0’s in front of value to “fill up” defined Output Length
Suffix 0s Will insert 0’s behind the value to “fill up” defined Output Length
COMP-3 Packed decimal binary (for EBCDIC and COBOL export only)
Type the custom char used in Cxxx, CCCxxx etc. in the field called “Trailing Char”. “Output Length” is set in the field next to the “Trailing Char”.
When working with CSV files its possible to manage delimiter type (comma, semi-colon, tab, space and |) and whether or not the field should be enclosed in “, ‘ or nothing. Header holding the fieldname can be added/removed by checking “Header”.
Fixed Length files can hold a “Line prefix” and a “End of line” indicator. These are set by typing the information next to these fields. As well as with the CSV format a delimiter can be added (none is standard).
“Codepage data” and “EBCDIC out” format can be of the type D8EBCDIC273 or WE8ISO8859P1.
When working with XML output the format can be adjusted by adding information of Header, Schema, Tags for All and Record Tags.
List options, examples
The following examples are based on the employee Report modified and described under “List, examples”.
As well as under the “List” tab it is possible to define pivot table by selecting between column or row grouping. In the example below Country is grouped in columns. Further it is defined that Department should be sorted descending.

Please read the section labeled “List and ”List Examples” for more information regarding grouping in columns/rows.
As well as under the “List” tab it is possible to work with several hierarchies. Please read the section labeled “List” and ”List Examples” regarding level breaks for more information on this subject.
In the example shown below Country is set as list hierarchy 0 and Department as level 1.

It’s possible to calculate an extra column next to the normal calculation information. The extra column can either show a running sum or as shown below a percent calculation of the Total. In this example the Column Caption is also changed to “Number of employees”

The result of the above settings is shown below:

When drill down is made i.e. by clicking the value next to England a new percent of Total is calculated for each Department represented in the Country.
When working with pivot tables it can be useful to have a accumulated total calculated in columns. With the setting as shown below this is automatically calculated.

The result look like this:

Aggregations can also be calculated directly in the groups. The presentation can be shown either in the cells or as a note. When selecting both aggregated features as shown below, the normal cell value is shown in the note.

In this example the aggregated number of employees working in the Accounting when calculating from CA to SE is 7. In the note it is possible to see that 2 persons are employed in SE when holding the mouse pointer over the aggregated figures.

Sometimes it’s meaningless to show row and/or column totals in the Report. E.g. when calculating accumulated pivot tables as described above, the row totals and the value in the last column is alike.

By selecting “Hide grand column totals” and/or “Hide grand row totals” these are hidden on the first hierarchy level as shown below.
Another useful feature when working with pivot tables, from where information is maintained is the “allow Drilldown from empty cells”. This allows the user to click on a department where nobody is employed. If the next level is detail level and rights are given to add new records into the dataset, it’s possible to add a new employee.

In the above example a click on the DK administration department results in an empty list where it’s possible to add a new employee.
It’s possible to work with different kinds of filters. In general there are three kinds of filters: Free search, Select and Compare. Free search filter is the default setting.
In the following example first “Select Data” filter is demonstrated and after that a “Compare Data” filter as well.
As shown below the Country filter is changed from “Free Search” to “Select Data” by clicking the option.

Dynamic AI will, if nothing else is done, build a drop down list with the represented countries as shown below.
An alternative to actually letting Dynamic AI use time on examining the data it’s also possible to use key lists which can be manually selected in the area shown below the search type definition or using dictionary settings as described above, during the theoretic description of filters.

By selecting Germany the result is presented as shown below.

When selecting the filter type “Compare Data” two drop down boxes is generated. The selection is made as shown below:

As shown below Department can now be selected in two drop down boxes:

The result of comparing the departments “Accounting” and “Production” is a column for each department and a third column showing the differences for each row grouper calculated as the first selection subtracted from the second selection.

It is possible to drill down from the column showing the difference in order to trace the difference.
In the following example most of the column captions are changed, and in order to present the details in a fixed width table all columns except ID is set to a width of 100 px.

The result is shown below:

Sometimes it’s useful to work with business graphs together with a table. When using pivot tables as the one exemplified under “Creating a pivot table” there are several ways to select how data will be presented.
On the General tab select a graph to add on the report

The result of the above graph definition is shown below.
![]()

Below the x-axis has been changed to departments (X-axis=Rows Values=totals):
![]()

When working with pivot tables, it can sometimes be useful to work with several series defined either as row or column groupers as shown below.
![]()

![]()

The tab “+Columns” is used to create new columns that can be included in the report, or extra columns based on data in other column fields. This is also the place where keyfigures can be defined.

With Extra Columns it’s possible to calculate e.g. average cost per order, turnover per hour or risk weighted balances or include different kind of case statements in order do alternative grouping in the report.
The Caption is presented in the Report as the title of the field.
It is possible to select between the following different types:
· Total (formula)
· Text (SQL)
· Number (SQL)
· Integer (SQL)
· Date (SQL)
Select “Text”, “Number”, “Integer” or “Date” when you want to create a new field based on a normal SQL statement (i.e. fieldname*12/fieldname2). The type selected in this case will let Dynamic AI know how to handle the result in the report.
“Total (formula)” should be chosen when you want to calculate extra columns based on the retrieved results in the report. This should be used when i.e. summarized group totals are the basis of the calculation (i.e. total revenue / total number of orders). Be aware that the “Total (formula)” type of extra column calculation only can be used on row grouped reports.
In this field the formula to calculate the values in the extra column or the SQL statement to compute the field is written.
It’s possible to add, subtract, divide and multiply the values.
In order to refer to the data columns in Dynamic AI “[[“ and “]]” have to surround the exact field name (case sentive).
It’s possible to define how many decimals that should be used to present the calculated value.
It is possible to specify Column width in px on custom defined “Extra-Columns”.
Key figures is shown in the bottom of the report and is a figure calculated on the results in the specific report.
This could for example be a calculation of the net result divided by revenues as shown below:

+Columns, examples
When using the SQL type of extra columns/fields it’s possible to use the SQL syntax that the underlying database supports.
That could i.e. be (on Microsoft Access)
iif (Empl_Country = 'US', 'North America', 'Europe')

This would give the opportunity to group on the new field:

The following syntax can be used when defining formula type of extra columns:
|
Type |
Syntax: |
|
General field / entity start delimiter |
[[ |
|
General field / entity end delimiter |
]] |
|
Include key figure |
[[//KEYFIGi//]] |
|
If – Then – Else |
%IF - %THEN %ELSEIF - %THEN %ELSE - %ENDIF |
|
Return rowgroup level |
%RGL |
In the below table is shown examples of how to define a formula type of extra columns:
|
Sample |
Syntax: |
|
Budget and YTD are summarized columns. Calculate extra column as difference |
[[YTD]]-[[Budget]] |
|
Budget and YTD are summarized columns. Calculate extra column as difference in percent of YTD |
([[YTD]]-[[Budget]])/[[YTD]]*100 |
|
Calculate extra column showing the relative share of “01 Gross Profit |
Key figure1: [[YTD::Group1==01 Gross Profit]] Extra column: [[YTD]]/[[//KEYFIG1//]] |
|
Full sum of YTD where Group1 (row grouper on the list) == “01 Gross Profit” and AccountID>”10101” |
[[YTD::Group1==01 Gross Profit::AccountID>=10100]] |
Please note that when using ”If –Then – Else” logic its not possible to combine the use of normal field refferals with key figure refferals I.e. [[YTD]]/[[//KEYFIG1//]] CANNOT be included in the “If – Then – Else”. In that case you need to do all calculations in the Key figure.
The following syntax can be used when defining keyfigures:
|
Type |
Syntax |
|
General field / entity start delimiter |
[[ |
|
General field / entity end delimiter |
]] |
|
Special character start and end delimiter |
// |
|
Next string is a field name and a filter |
:: |
|
Possible filter operators |
== , >= <= , <> |
|
To calc across all summarized columns instead of using column field name |
//SUMCOLL// |
In the below table is shown examples of how to define keyfigures:
|
Sample |
Syntax |
|
Full sum of the column “YTD” |
[[YTD]] |
|
Full sum of YTD where AccountID=“10100” |
[[YTD::AccountID==10100]] |
|
Full sum of YTD where Group1 (row grouper on the list) <= “01 Gross Profit” |
[[YTD::Group1<=01 Gross Profit]] |
|
Full sum of YTD where Group1 (row grouper on the list) == “01 Gross Profit” and AccountID>”10101” |
[[YTD::Group1==01 Gross Profit::AccountID>=10100]] |
|
Budget and YTD are summarized columns. Create full sum of both as key figure |
[[//SUMCOLL//]] |
|
Budget and YTD are summarized columns. Create full sum of both where AccountID=“10100” |
[[//SUMCOLL//:: |
A form is usually a presentation of a single record from a table or view. It is possible to show much more information on a form than on a list, as the entire screen can be used for a single form. The appearance of the form is also much more easily designed. Fields can be placed anywhere, fonts and colors can be changed.
The Dynamic form can also show pictures linked to form fields, and even Reports of related records.
Under the “Form” tab, the overall presentation is determined. This includes indicating what fields should be included on the form, the order (and tab-order) of the fields, what fields Dynamic AI should generate key value lists for and the basic style for the form.
Please refer to the following screen sample:

Per default all data fields from the database table or view will be included on the form, and thus appear in the box marked “Selected fields”. Fields you don’t want to appear on the form are moved to the “Available fileds” box.
This is done by highlighting the fields using the mouse, and clicking the “Del” button between the two boxes. To move a field back, press the “Add” button.
If new data fields are added to the underlying data source, they will automatically appear in the “Available fileds” box at next customization. In this way new data fields won’t interrupt in already created forms before they are actually moved to the box marked “Selected fields”.
Fields in this box will be displayed on the form. The order of the fields in this box matches the order the auto layout is build, and more importantly the tab-order in the final form.
If there isn’t set up any dictionary definition as described in the “Dynamic AI Administration” guide, Dynamic AI will use the reference Report defined under the tab “Form details”.
For example: If a text field can hold country codes in the form US, UK, GE, DK etc, you can force users to select from a list of valid country codes, and additionally help users by showing the list with the full country names instead of the abbreviations. This is discussed further in the “Form details section”.
Using Key value lists, is especially relevant when capturing data, as you can ensure that the field will only hold valid values.
The key value combo boxes will also be shown/used when working with editable lists.
When this option is selected, a small version of the form is shown. This helps you ensure that your actions have the desired effects.
Here you select which pre-defined style you want applied to the form.
Applying a certain style to a number of Reports will ensure that they share the same design elements, such as fonts, colors and logos defined in the style.
Dynamic AI defaults to the style set on the database connection. If you want to select a different style, choose one from the drop down box.
The use and creation of style sheets is described in details in “Style maintenance”.
The final design of the form is made on the “Layout” tab. You can refresh the automatic form layout by checking this box.
It’s possible to choose whether the auto form layout will be columnar with captions to the left of each field or with captions above the field names.
After applying the auto layout, further adjustments can be made in the layout mode.
This form presentation, will give you one field per row, with field caption to the left of each field. The order is as specified above.
This form presentation gives you 3 fields per row, with field captions appearing above each field.
Options for field display and default values are found on the ”Form details” tab. Refer to the screen dump below:

If ”Build key value list” has been specified on the ”Form” tab, this screen will allow you to set the options for each of the key value lists.
This lists the fields for which a key value list is to be built. The field name shown is the same as on the “Form” tab.
In the first Combo Box, select the Report where the lookup values can be found.
When you have specified a different Report, the next two combo boxes will be populated.
Note that the values for the drop down box you choose are generated on the fly. If the lookup table is very big, it could be to your advantage to build a smaller table with just the needed values, as this will increase performance.
Also note that the users that you give access to this Report also have to be granted access to the Report you use for lookup values.
In this field, select the field in the foreign Report that matches the field in the current Report.
In this field, select what field from the foreign table you would like the users to see.
Per default, Dynamic AI will present data as the same type the underlying data source dictates. However, it is possible to design how data are displayed.
This could be relevant if a numeric value is stored in a text field, or if you want to display a column with checkboxes instead of the values 0 and 1.
This is also where data are marked read-only.
These values are used to reference the fields. Original field names are preserved – even if their captions have been changed (see List details and/or Layout)
You can enter default values for new Records. You enter any text or number or the Dynamic AI keywords (@Username, @UserID, @Alias1-@Alias5 etc. which are described in details in the “Dynamic AI Administration” guide).
It’s also possible to use settings like Now() which will result in a datetime stamp:
GETDATE()
NOW()
DATE()
GETDATE() returns the current date and can be used on a SQL Server database. NOW() returns the current date and time. DATE() returns the current date. NOW() and DATE() can be used on Access databases only.
Refer to the explanations below:
Field for normal, editable string values.
Use to present numeric values as whole numbers. This would be handy if an account number or zip-code has been stored in a numeric column that supports decimals, as Dynamic AI would otherwise format the zip-code ‘90210’ as ‘90,210.00’
Fields of this type are formatted according to the user’s formatting preferences.
(9.999,00 instead of 9999)
Used if the underlying database has the column set to ”Increment” or ”Auto number”. This means that the database automatically assigns a new ID number to new records. See Dynamic Increment, if you want to achieve this functionality on databases that do not support it natively.
All date-type fields (DATETIME) are displayed as date only by default – and formatted according to the users preferences.
By specifying date time, a date will be presented including the time - the data will be formatted for presentation according to the users date-notation preference.
This data type renders a multi line text box. Can be of use with longer texts.
Renders the fields as ******
If the native data type for the field is true/false (BINARY), Dynamic AI automatically displays data in a check box. Otherwise, you can select one of the other check box options that work against numeric or text fields:
• 1/0 (1 = true)
• Yes/No (Yes = true)
• On/Off (On = true)
• User Stamp (<>null = true)
The User Stamp option is presented as a check box, but the data written to the database is the username for the current user and a timestamp. This is particularly useful for approval workflow type applications.
The Computed stamp feature is a good way of tracking changes in the data made through Dynamic AI.
If a field is set as computed stamp, the field will be automatically updated whenever the record is added or updated.
The value inserted is the one written in the “Data-input default value” to the left of the field type.
A field defined as a Computed stamp is automatically set as read only.
The only difference between the hidden feature and the normal “Computed stamp” is that the field will not be showed on form layout.
Hidden fields won’t show up on the form, but will be updated. This is needed if you don’t want a certain field to be shown but the data source requires the fields to be part of the update statement.
This data type is used when you want a certain value registered in the field, but don’t want to display the field or the value to the user.
A database text field can be changed to a document link, which makes it read-only, and presents the content as a link.
This is useful if a database stores records of scanned documents, with links to the network resource where they can be found.
If the database holds a field with email addresses, setting this data type will render a link to sending an email to the address associated with the current record.
This type is similar to email. It looks like a normal text box, but has a small button that attempts to open a new browser window with the URL entered in the field.
Dynamic increment is used for databases that do not support Increment (Identity) or Auto number columns. Upon insertion of new rows, Dynamic AI will scan the table, and assign an ID-number to the field that are one higher than the highest registered value in the database.
Some Databases include an “end of file” char in the data values. The browser recognizes the "end of file" char as END OF file and stops rendering the page - causing the page to be displayed incorrect.
When setting a field type to “Remove illegal chars” Dynamic AI removes "end of file" char (asc code 0) from field content, and the browser will now show the whole page instead of breaking the rendering.
When applying “Record readonly flag” as data type to a field, it is possible to disable the possibility to update records that meets the flag set in the data input default value. If the content of the field in a specific record is similar to the default value then the record will be read only.
Record writeable flag works in the same way as “Record readonly flag” but is instead setting the record to be updateable if it meets the default value.
When working with several flags on different field the work as “and” statements. This means that all flags have to be fulfilled before the record is updateable.
Fields can be marked read-only, so users can see their content, but not change the data.
Form details, examples
The following examples are based on a Report showing the employees working in Germany, which is actually the employee table filtered for country=”GE” which has been set under the Condition tab (see the section “Conditions” for more details on how to set conditions on Reports.
The Report is a list editable Report, where it’s possible to add, update and delete records, which in this example means employees. Below is showed the presentation of the Report:

When adding new records it can be useful to include a key value list on some fields in order to secure that the data inserted is correct. I this case it will for example be useful to secure that new employees is connected to an existing department. Below is showed how this is set:
Under the form tab DepartmentName is set to use a key value list as shown below:

Under the Form details tab it is now possible to select which key value list to use when inserting new records or updating the Departments.
By using the search options it easy to find the right Report to use as a key value list. Simply enter a part of the name of the Report you are looking for (in the field “Enter filter here”) and press Enter. The drop down box will be filled with every Report that meets the search values.
By selecting the Report “Departments” it is ensured that only existing departments can be used:

The result of these settings is showed below:

The key value list will also be shown on the form presentation.
When adding new records to a dataset it can sometimes be useful to set default values on the Reports in order to keep the fields that need to be updated to a minimum. For example when adding new employees in England it should not be necessary to write “GE” each time a new employee is inserted.

By giving the field [Country] the default value “England” this will appear whenever a new record is inserted as shown below:

Of course the user can change the default value. If you will force “GE” to be written in the field change the field type into “Hidden use default” and remove the field from the list.
This tab is only available when working in Internet Explore (IE) since drag-drop is not implemented for other browsers than IE.
This is where the final layout of the form, object placement and inserts of other elements are determined.
The style chosen as default for the connection and auto generated fields, is the basis of the form. The style can be overwritten on the “Form” tab. The order of the fields (tab-order) can also be modified here.
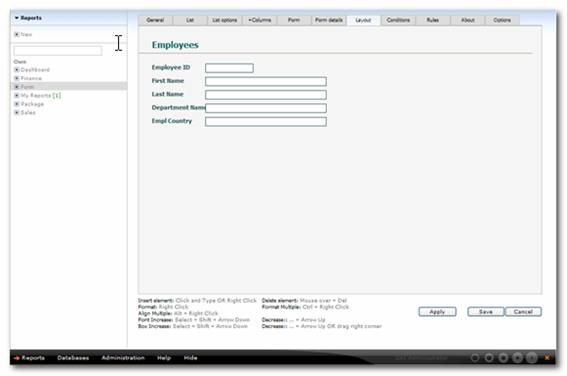
The following screenshot shows an auto generated form layout with modifications as described under “Form, examples”.

By double-clicking on a text (including field captions) you enter edit-mode. It is now possible to change the text.
You can use the cursor keys to move around in the text and the delete key to get rid of unwanted characters.
By left clicking and holding an element (including fields and captions) you can drag elements around on the screen. Let go of the mouse button when they are at the desired position. You can also single click the element, and move it using the cursor keys on the keyboard while holding down the [Ctrl] key.
If you want to move more elements at one time, you can ”draw” a rectangle with the mouse around the elements you want to move. Start by marking the upper left corner of the rectangle, hold down the left mouse button and drag to the point that marks the lower right corner – then release. Now you can move the entire contents of the rectangle by drag and drop.
When you’ve drawn a rectangle, you can right-click it and change it’s color.
By right clicking a text field, you get the Format dialog, where you can set fonts and color options for the particular text or text field.

You can choose the font, font size, weight, alignment, color, background color and border.
Color modifications are made through the below dialog.

You can choose from the preset palette, or enter your own using the hexadecimal RGB notation (for example #FF33AA). Color names defined in HTML (such as light blue) are also allowed.
Another way to change the font size is to single click the text and then use up/down arrows while pressing [Shift].
It is suggested to modify the style or create a new if a change applies to multiple forms. This makes maintenance much easier as you can change the style only instead of multiple forms.
If you want to change fonts or colors on several elements at one time, you can ”draw” a rectangle with the mouse around the elements you want to format. Start by marking the upper left corner of the rectangle, hold down the left mouse button and drag to the point that marks the lower right corner – then release. Now you can format the entire contents of the rectangle by pressing the [Ctrl] button and right clicking the rectangle.
Clicking and dragging on the lover right corner of the element will resize elements (not text fields).
Another way of resizing an element is to single-click the element and resize it by using the cursor keys while holding down the [Shift] key.
If you want to resize several elements at one time or align them, you can ”draw” a rectangle with the mouse around the elements you want to resize / align. Start by marking the upper left corner of the rectangle, hold down the left mouse button and drag to the point that marks the lower right corner – then release. By pressing the [Alt] button and right clicking the rectangle the following dialogue box will appear:

It is possible to align the selected objects to either the most left, right, top or buttom represented object in the selection.
It is possible to resize the selected objects to either the widest, narrowest, tallest or shortest represented object in the selection.
A good way to ensure that there is the same space between the objects is to use the spacing functionality. With this it is possible to have objects presented next to each other or by clicking +/- move the objects away/closer to each other.
Once you have moved the fields you might want to present the corresponding caption field next to the field that holds the data.
You can select between a presentation of the caption left of or on top of the field.
You can insert new elements on a form. Elements can be images, URL links, text boxes or even other Dynamic AI Reports.
By right clicking in the empty space on the form, the below dialog is shown.

This dialog is used for inserting all types of elements, except boxes (which are drawn directly)
In the upper part of the dialog box, you can choose what kind of element you want to insert.
When you click on “line”, the dialog box closes and a horizontal line is inserted. The line can be moved around and positioned with the mouse.
When inserting an image, you can either state a static location of the image (as an URL), or if your data source holds a list of image locations, you can point to the field that holds the image location. It is important to understand that the image location must be accessible from the intended client computers web-browser. If pointing to an image on the local Report-creators hard-drive, only users who have the file located on their hard-drive will be able to see it.
When inserting a www address, you can either enter a static address, or point to a field on the current data source that holds the address.
The URL will in any case be rendered in a frame on the current form, along with a small button that is used to open the link in a full screen browser.
Choose insert ”doc” to insert a document link (a .jpg or .gif picture). Document links are links to other documents that are referenced in the data source.
It is important to understand that the document location must be accessible from the intended client computers web-browser. If pointing to an document on the local Report-creators hard-drive, only users who have the file located on their hard-drive will be able to see it.
You can insert another Dynamic AI Report on a form by choosing “Dynamic” and then selecting the desired Report.
If relations have been set up, you’ll have the option of inserting filtered Reports. The valid filtered Reports will be shown below the regular Reports.
It’s possible to present the Report either in an I-Frame or as a link.
If you choose to present the Report in an I-frame, you can decide how you want the Report presented. You can choose among the Reports styles graph, list or form.
To delete an element, select it by single-clicking it, then delete it by pressing the [Delete] key.
Layout, examples
The following examples are based on an auto generated form layout with modifications as described under “Form, examples”.
The form (in Layout mode) is shown below:
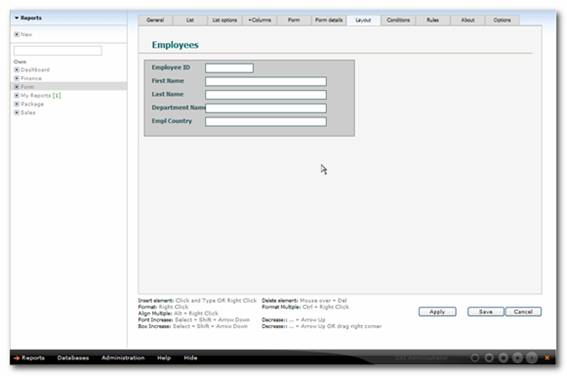
To insert a box with any size on the screen simply draw it by left clicking the mouse and drag the mouse to the lower right. In this way a box is drawn. By right clicking the box it is possible to select color and border for the box.

After coloring the box, it is still possible to change the size of it by clicking and dragging on the lover right corner or the element.
By right clicking on the screen under the layout tab the following dialog box will be showed:
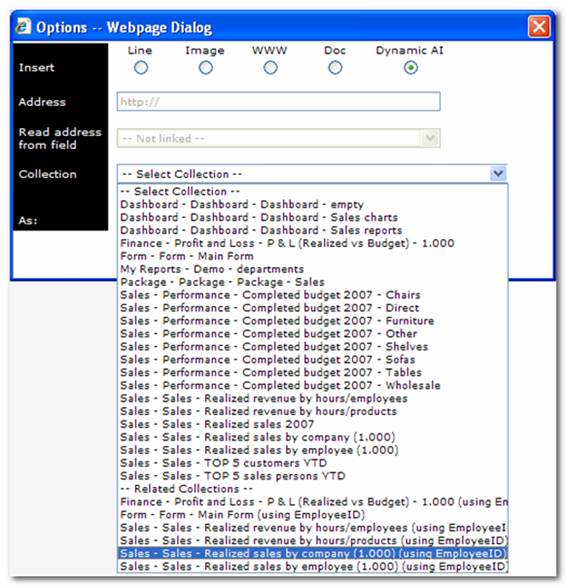
It is now possible to select other Reports to be inserted in an I-frame on the Form. If there is set any relations, related Reports will be shown in the bottom of the drop down box as shown above. Read more about how to set up relations in “Relation maintenance”.
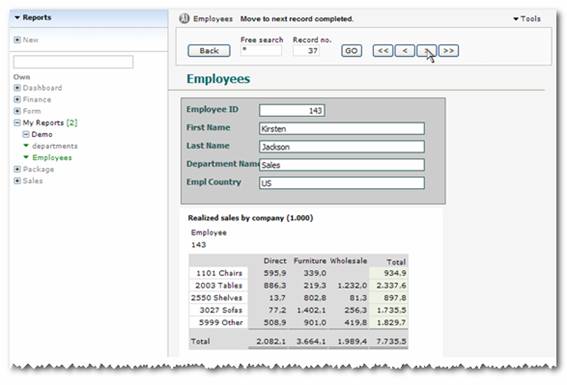
The result of selecting “Realized sales by company (1.000)” as relation is shown below:
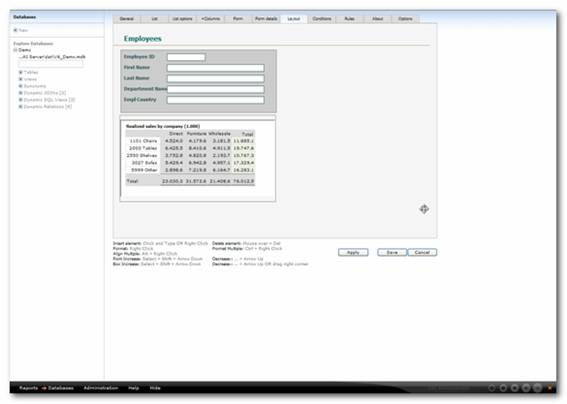
As you can see the whole Report is presented in the layout mode, but when the user views the form of an employee the result is automatically filtered by the employee ID.

When navigating through the employees by clicking the arrows in the top of the Report, the report “Product Sales by country” is automatically updated and filtered for the new employee.
Data selection criteria are defined under the “Conditions” tab.
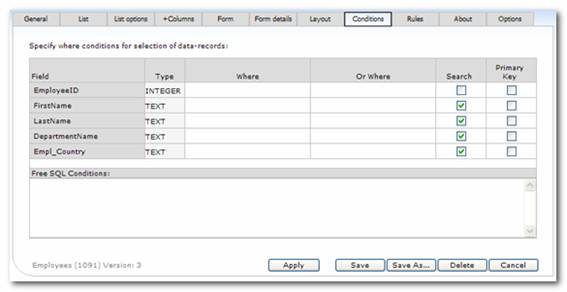
All the data fields are listed with the original field names under this heading (also if their caption has been changed under “List options” or “Layout”.)
The field type may help users to input static conditions in the right format. However Dynamic AI still does a number of conversions automatically.
The “Where” columns is where the data selection criteria for the Report is defined. The conditions set are working on record level.
The following operators are available:
|
Operator |
Field type |
||
|
Text |
Date |
Number |
|
|
>= |
Yes |
Yes |
Yes |
|
=> |
Yes |
Yes |
Yes |
|
<= |
Yes |
Yes |
Yes |
|
=< |
Yes |
Yes |
Yes |
|
<> |
Yes |
Yes |
Yes |
|
= |
Yes |
Yes |
Yes |
|
> |
Yes |
Yes |
Yes |
|
< |
Yes |
Yes |
Yes |
|
LIKE |
Yes |
No |
No |
A specific value is set by typing the value itself. When using text (string) criteria – do not quote the text – Criteria should be north – not ‘north’ or “north”.
Operators like ”>”, ”<” and ”<>” as shown above is set without spaces after the operator (e.g. <>3).
When working with “like” statements wild cards is set with a “*” or a “%” (e.g. LIKE nor*)
Handling filtering on empty cells (Null) is sometimes necessary. The following statements can be used for this:
· NOT IS NULL
· NOT ISNULL
· NOT NULL
· IS NULL
· =NULL
· ISNULL
· NULL
The following statements can be use on date fields:
· GETDATE()
· NOW()
· DATE()
GETDATE() returns the current date and can be used on a SQL Server database. NOW() returns the current date and time. DATE() returns the current date. NOW() and DATE() can be used on Access databases only.
It is also possible to use aliases in the where statements. This is a way automatically to filter a record set based on which user actually is viewing this Report.
For instance, the user KMA, has alias1 set to “United Kingdom”, and the user LMO has her alias1 set to “Singapore”. By defining the keyword @Alias1 in the condition for the “Country” field on a Report, the users KMA and LMO can share the same Report, but they each see only data that meets the condition, so KMA sees only UK customers and LMO only customers from Singapore.
Apart from the keywords @Alias1 - @Alias10, the Keyword @Username or @UserID can also be used. These keywords are described in details in the “Administration” section.
This column is used where there’s more than one parameter for the criteria, for instance if the value must be equal to X or equal to Y.
The checkboxes in this column are used to indicate whether the field is searchable. The checked fields will appear in the “Free search” box in top of the Report.
In order to ensure unique order presentation of returned records from certain databases it can be necessary to define the unique key on the underlying data-source. The “Primary Key” will be used as the last sort key on the Report when presenting record level information at the lowest level to end-users ensuring drill down to form always will show the correct form.
To ensure correct form presentation of a record this setting has to be set when working with Dynamic Joinbuilds (due to the automatic SQL modification depending on the exact used fields in the data source).
Advanced users have the option of writing their own where clause for SQL-compliant data sources. This can be relevant if there are more than two where clauses or for other special purposes. Knowledge of the SQL language is required, as well as a knowledge of the underlying data table.
Conditions, examples
The following examples are based on a Report showing the employees as a list. Before setting any conditions on the Report the list is presented as shown below:
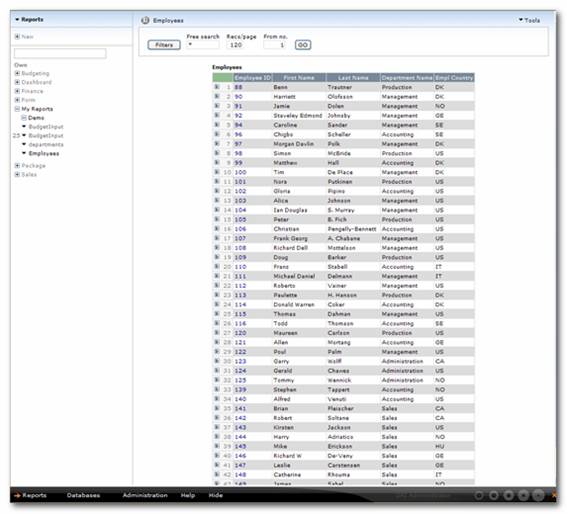
A condition is simply set by writing the text/value in the “where” column
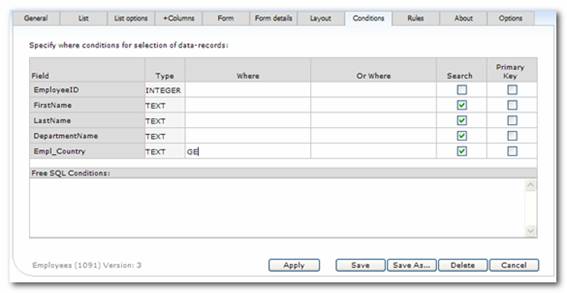
The result of writing “GE” is a list looking like the one below:
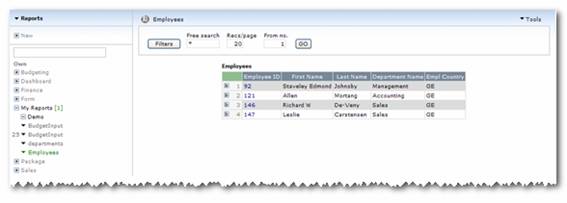
It is possible to use “Or” by writing a second condition in the “Or where” column. In this case we want to see a list of employees working in Germany or Denmark.
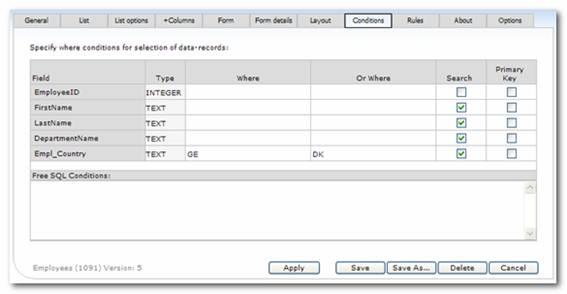
The result of the above conditions:
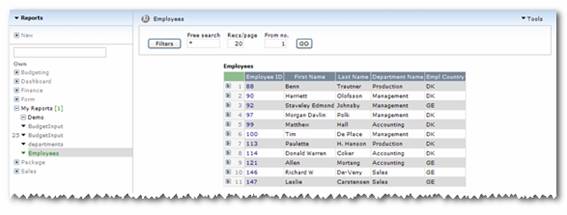
It is also possible to use operators as <, > and =. In the next example we want to see employees working in Germany or in countries which is alike Denmark or “less” than Denmark.
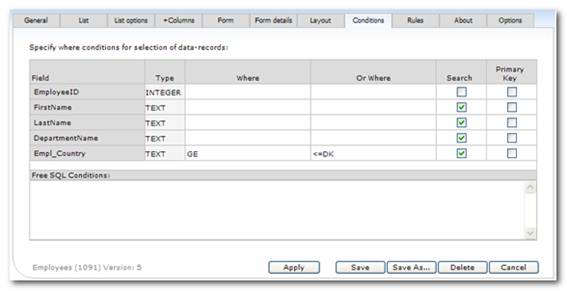
The result is a list including employees from Germany (GE), Canada (CA), Switzerland (CH) and Denmark (DK).
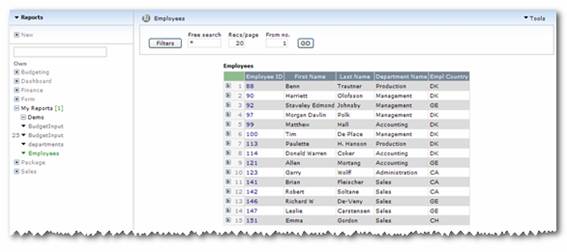
It is possible to use “*” and “%” as wild cards when setting conditions on a Report.
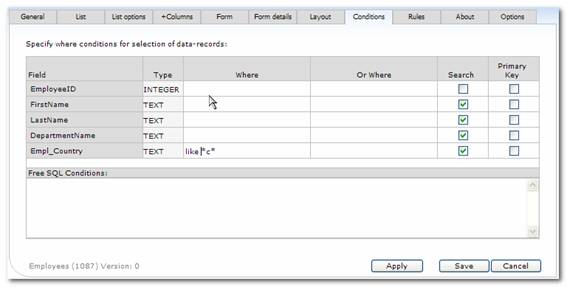
In this example any country with a “C” in its name is presented in the list. The result is a list with employees working in Canada (CA) or Switzerland (CH).
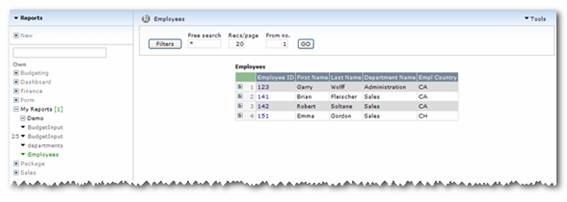
Sometimes the two “where” columns is not enough to set the wanted filters. E.g. when working complex and/or conditions in different situations.
In the “Free SQL Conditions” it is possible to write any SQL code to set conditions for the output of the Report.
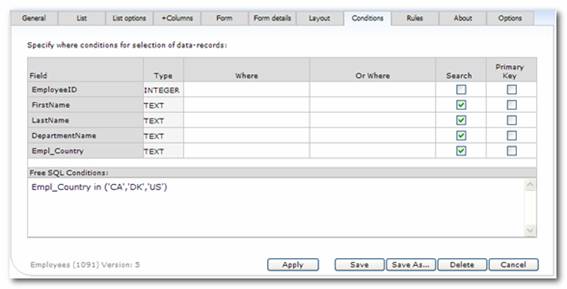
In this example any employee working in Canada, Denmark or USA is listed.
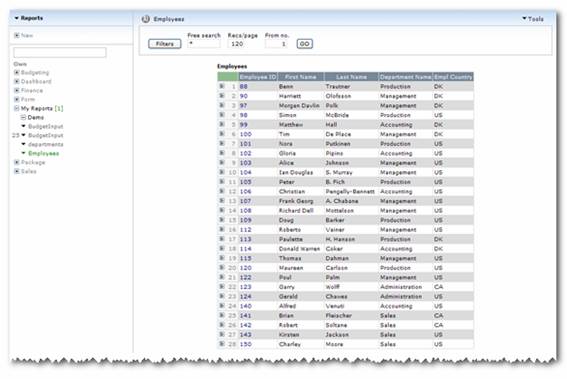
The Rules-tab provides an input box where custom client-side JavaScript can be entered. The script entered her will be included on the Report (Dynamic AI prefixes the script with the HTML tag"<Script Language=JavaScript>" and suffixes with the HTML tag "</SCRIPT>").
Dynamic AI in does not validate the script entered here.
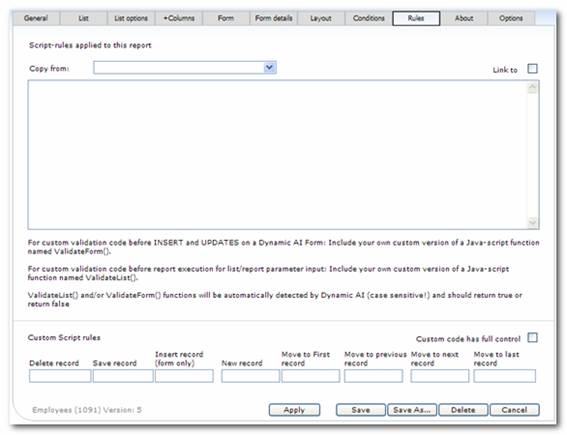
The combo box “Copy from” gives the possibility of copying script made on other Reports. When choosing the Report the script will automatically be posted in the input box.
After choosing a Report in the “Copy from” combo box it’s possible to select that the script in this Report at all times follows the script made on the “mother” Report.
The custom Script rules submit the <FORM> to the defined target and it is possible for the developer to handle this event with full control. The procedures shall reside on a web server that is accessible from the client computer and can be in form of .ASP, .ASPX, .PHP, etc. depending on web server configuration where the files resides.
By default Dynamic AI perform the normal action (E.g. the delete of a record) and after that additionally runs the procedure referred to.
When selecting “Custom code has full control” the Dynamic AI action is disabled on the Report.
Rules, examples
Below is an example that validates the entered date in free search filters together with a check if field “A” and “B” or field “A” and “C” are specified:
var dtCh= ".";
var minYear=1900;
var maxYear=2100;
var HistDays=100;
function isInteger(s){
var i;
for (i = 0; i < s.length; i++){
var c = s.charAt(i);
if (((c < "0") || (c > "9"))) return false;
}
return true;
}
function stripCharsInBag(s, bag){
var i;
var returnString = "";
for (i = 0; i < s.length; i++){
var c = s.charAt(i);
if (bag.indexOf(c) == -1) returnString += c;
}
return returnString;
}
function daysInFebruary (year){
return (((year % 4 == 0) && ( (!(year % 100 == 0)) || (year % 400 == 0))) ? 29 : 28 ); } function DaysArray(n) {
for (var i = 1; i <= n; i++) {
this[i] = 31
if (i==4 || i==6 || i==9 || i==11) {this[i] = 30}
if (i==2) {this[i] = 29}
}
return this
}
function isDate(dtStr){
var daysInMonth = DaysArray(12);
var pos1=dtStr.indexOf(dtCh);
var pos2=dtStr.indexOf(dtCh,pos1+1);
var strDay=dtStr.substring(0,pos1);
var strMonth=dtStr.substring(pos1+1,pos2);
var strYear=dtStr.substring(pos2+1);
strYr=strYear;
if (strDay.charAt(0)=="0" && strDay.length>1) strDay=strDay.substring(1);
if (strMonth.charAt(0)=="0" && strMonth.length>1) strMonth=strMonth.substring(1);
for (var i = 1; i <= 3; i++) {
if (strYr.charAt(0)=="0" && strYr.length>1) strYr=strYr.substring(1);
}
month=parseInt(strMonth);
day=parseInt(strDay);
year=parseInt(strYr);
if (pos1==-1 || pos2==-1){alert("The date format should be : dd.mm.yyyy");
return false;
}
if (strMonth.length<1 || month<1 || month>12){ alert("Please enter a valid month");
return false;
}
if (strDay.length<1 || day<1 || day>31 || (month==2 && day>daysInFebruary(year)) || day > daysInMonth[month]){
alert("Please enter a valid day");
return false;
}
if (strYear.length != 4 || year==0 || year<minYear || year>maxYear){
alert("Please enter a valid 4 digit year between "+minYear+" and "+maxYear);
return false;
}
if (dtStr.indexOf(dtCh,pos2+1)!=-1 || isInteger(stripCharsInBag(dtStr, dtCh))==false){
alert("Please enter a valid date");
return false;
}
UDate = new Date(parseInt(strYr),parseInt(strMonth)-1,parseInt(strDay));
todayPlus = new Date();
todayMinus = new Date();
plusDate = todayPlus.getDate() + HistDays ;
minusDate = todayMinus.getDate() - HistDays ;
todayPlus.setDate(plusDate);
todayMinus.setDate(minusDate);
if (UDate<todayMinus) {
alert("Please enter a date not older than "+HistDays+" calender days - i.e. after: "+todayMinus);
return false;
}
if (UDate>todayPlus) {
alert("Please enter a date before: "+todayPlus);
return false;
}
return true;
}
function ValidateList(){
var dt=document.BB.FPARM1_;
if (isDate(dt.value)==false){
dt.focus();
event.returnValue=false;
return false;
}
var req1=document.BB.slctvalA6.value;
var req2=document.BB.slctvalA7.value;
var req3=document.BB.slctvalA9.value;
if ((req1=='*' || req1=='')) {
alert('A6 and A7 or A6 and A9 must be specified');
event.returnValue=false;
return false;
} else {
if ((req2=='*' || req2=='')) {
if ((req3=='*' || req3=='')) {
alert('A6 and A7 or A6 and A9 must be specified');
event.returnValue=false;
return false;
}
}
}
return true
}
The above example can be used as inspiration, but please note it needs to be designed to the specific case, where it should be used.
The “About” tab provides a space to describe the Report. This could be a short instruction to the user, or a message indicating that the Report is work-in-progress.
The about can be set up as a link to another site or by entering the text in the window below. By including a link in the “About window URL/Link” or a text the users will see the about page presented when they select about either by clicking next to report name in the report menu or selecting about in the tools menu.
Any text included in the report header will be shown in the top of the report. When printing the report this element will be shown on each page unless “Print on first page only” is checked.
The text can be formatted with standard HTML tagging.
Any text included in the report Footer will be shown in the bottom of the report. When printing the report this element will be shown on each page unless “Print on last page only” is checked.
The text can be formatted with standard HTML tagging.
About, examples
The following example is based on the Report employees referred to in the section “List, examples”.
Under the about tab it is possible to write any text wanted to be shown as a help text on the Report.
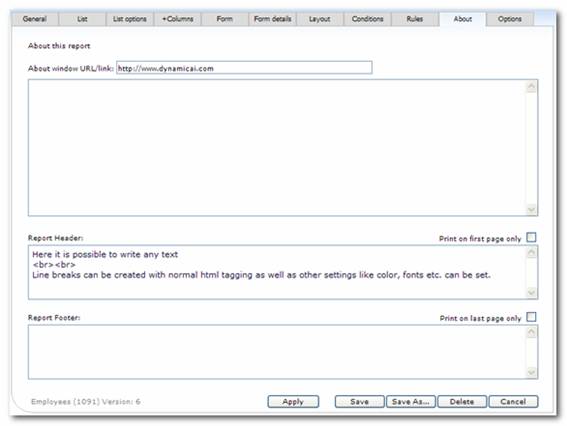
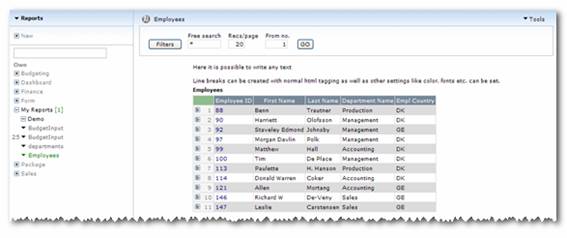
The general about text and or the URL/Link defined can be reached in the report menu or in the tools menu:
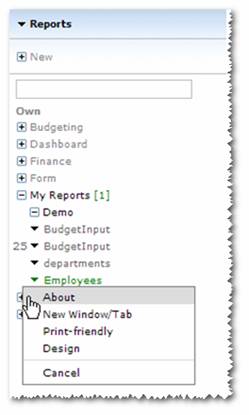
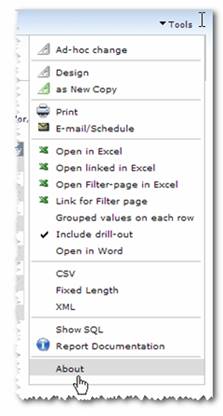
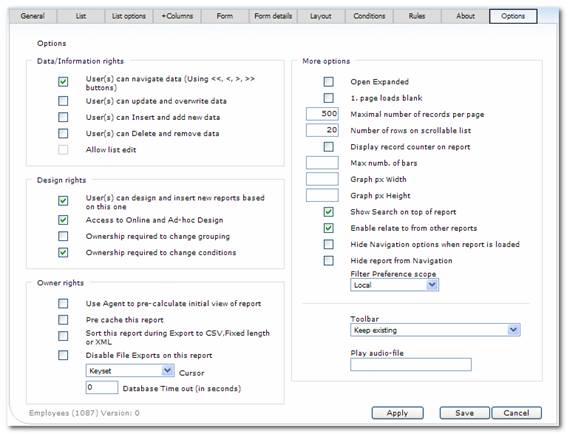
This is where access to the Report information is administrated. The permissions set here apply to the users and owners of the Report.
Apart from data navigation, you can also let users add, modify or delete data. The settings regarding data modification will only take place when the database connection change from “read only” which is the default setting AND that user working with the report isn’t a “read only” user.
The “Allow list edit” box enables list editing, thereby allowing users to manipulate information in a multi-row data grid interface. If this option is not checked, users will only be able to update data in form mode.
The Dynamic AI interface adapts to the users rights, so users will only see buttons in the function line, matching the permissions they have on the current Report.
Under this heading, you can set options for whether users can update the Report, make copies of it or delete it.
This is used to give users of the Report access to save changes when designing the Report.
This feature gives users access to modify the Report via Ad-hoc change, but not necessarily the access to save the changes.
If ownership is required to change grouping users will not be allowed to add new groupers or change existing ones, when designing the Report.
This setting will allow certain groups of users, not owners or developers to have access to Conditions. The option will open the Condition page for non-owners that have access to Design. The default behavior is that Ownership IS required to enter the conditions page (option is checked).
This feature is only available in the Server Edition of Dynamic AI.
For Reports with a particularly complex database query, it might be relevant to let the agent calculate the initial view, thereby giving users a faster presentation when they start working with the Report.
Once the user drills down, the database will be queried in real time. This will typically give an acceptable response time, as the next view will be of a specific subset of the database, rather than an aggregated view of all the records.
Note that when a report is pre-calculated it will be displayed as it was defined without looking on the user alias and role settings. Therefore it’s not recommended to use pre-calculation together with alias/roles restricted reports.
This feature is only available in the Server Edition of Dynamic AI.
Pre caching is an alternative to the agent. If this option is enabled, the initial view is computed on Report creation (and modifying).
Users are presented with the date and time of the used dataset, and can choose to update data (and thereby refreshing the cache if they are not satisfied with the age of the result.
This functionality is especially relevant for Reports based on heavy queries, with data that doesn’t change that often.
Be aware of the same limitations in pre-cached reports as described for pre-calculated reports above.
Normally sorting of record sets would be waste of processing in case of export to CSV, XML, Fixed length. However this default behavior can be overridden with the option “Sort this Report during Export to CSV,Fixed length or XML”.
By checking this the user of the Reports won’t be allowed to save the report as a CSV, Fixed Length or XML file.
This is the database cursor type used when retrieving a recordset from the database. Normally this should be left as set by Dynamic AI, but you might find situations where another cursor will be better. There are 4 possible values to be set:
Forward only cursor
Keyset cursor
Dynamic cursor
Static cursor
If the Report is extraordinarily complex (or the database server performs poorly) a time out can occur. Setting a value in this field will override the default time out value. Be careful with using a setting that is too large. Time outs sometimes indicate that something is wrong. Your Database Administrator might be of help.
When working with tables/views, which are registered as a partition in the Dynamic AI Dictionary, this feature is also shown on the Options tab.
This property enables or disables table partitioning on the Report.
With enabled partitioning the Report always preloads with a dropdown box in which the user selects which table partition to work on.
With this option disabled the Report loads without any partition-dropdown box, and the Report reads from the original table or view.
Partitioning is described in details in the “Partitioning:” section.
If partition compare is enabled on a partition Report, the normal preloaded dropdown box is changed to two dropdown boxes, which allows comparison between two tables.
More options define other specific rules for the Report.
When this function is activated, a grouped list will automatically be opened expanded. This is very useful when presenting grouped detail information in list form.
This option refers to lists with filter boxes applied. When “1. page loads blank” is activated the Report wont return any records before filters are chosen and the [Go]-button is pressed.
As default Reports is set to return a maximum of 300 records at each list level.
This limit acts as a break to ensure that result sets that take up unnecessary resources. Often (but not always) a large result set indicates that additional filtering or grouping of the Report is relevant.
If a Report returns the message “This is not the full list”, you can change the settings to force Dynamic AI to return all records.
Before changing this default value please reinsure that the Report is made exactly as you want it to be.
When working with simple lists that are scrollable the default number of rows on each page is set to 20. If you want to change this setting simply just edit your preferred number of rows here.
It’s also possible for the user when working with the Report to change the number of records displayed, by typing the number of rows in top of the Report.
By checking this feature Dynamic AI returns the number of records included in the Report. The counter is presented in the top of the Report.
“Max numb. of bars” defines how many values from a grouped list to be shown in the chart. If nothing is set (“0”) the first 5 values will be shown by default.
This feature defines whether or not it is possible to use Dynamic AI free search on the Report.
If this feature isn’t set to true it wont be possible for the user to “jump” from another Report to this Report by using “Drill-down to” on the General tab.
You can decide that the Navigation menu will be hidden when a Report is presented. A user can click “Reports” in the toolbar in the bottom of the Dynamic AI screen to activate the Navigation menu.
When a Report is inserted it will automatically appear in the Navigation Menu in the left side of the screen. If you don’t want it to be shown here, you can click on the “Hide Report from Navigation” to make this feature active. To actually force the report to be shown “Include Hidden” has to be set on the individual users Report menu.
The filter preferences are used to determine whether or not a used filter value should be remembered for later use on other Reports.
The preference can be set to 3 different values:
· Local (default)
· Global
· None
If a filter is used on a Report that is set to “Local” the selected value will automatically be suggested on other Reports based on the same data source, using the same filter and also set to “Local” (in that specific browser session).
If a filter is used on a Report that is set to “Global” the selected value will automatically be suggested on other Reports using the same filter and also set to “Global” (in that specific browser session). Please note that the only difference to “Local” is that the other Reports do not have to be based on the same data source.
If “None” is used the filter values will not be “remembered”.
A toolbar is an alternative menu shown in the top of the Dynamic AI screen.
A toolbar is based on packages (grouping of Reports created under “New/Package”). If you chose to keep the existing package when showing the Report, the package shown to the user before opening this Report isn’t deleted.
Using toolbars are a good way of creating user-friendly workflow applications within Dynamic AI.
An audio file can be selected to play automatically when a Report is presented. Simply type the address of the audio file in the appropriate field.