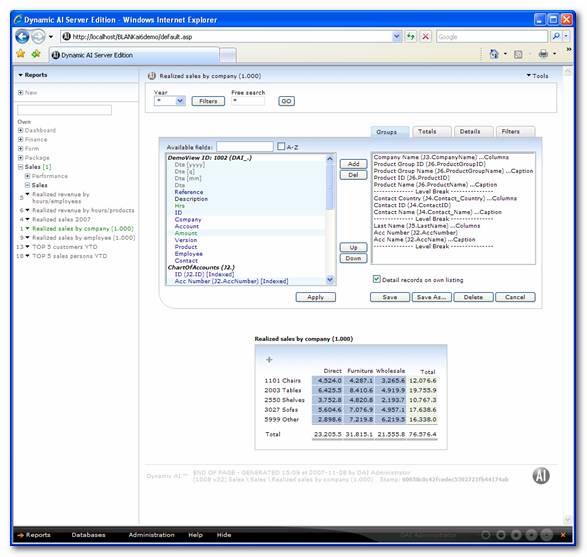
Ad hoc change is a feature that gives access to simple design of a report.
When clicking on the menu item the screen will change having a simple design module shown between filters and the actual report presentation.
Another way of reaching Ad-hoc change is by clicking on the “Filters” button, the group-, total- or detail-header on the report. When doing that Ad-Hoc change will open focusing on the type that was clicked (Groups, Totals, Details or Filters).
Available fields
The “Available fields” box shows all the fields included in the table/view. From here it’s possible to select the fields and move them into Groups, Totals, Details or Filters.
If new fields are added later to the underlying table/view, these fields will automatically be shown in the “Available fields” box. In this way new fields won’t interrupt with original Report definitions.
By clicking on the different tabs you can select which field handling to work with. I.e. if you wish to define fields that should be filtered you need to click on Filters before adding the fields. It is also possible to change between the types simply by right clicking inside the “Available fields” box.
The easiest way to toggle between Groups, Totals, Details and Filters is by right clicking inside the “Available fields” box.
When moving field names into the different types of field handling you can use the [Add] and [Del] buttons after you have selected which fields to move. It is also possible to add fields simply by double clicking the field name in the “Available fields” box.
The easiest way to move fields from Available fields into Groups, Totals, Details and Filters is by double clicking the field name in the “Available fields” box.
Fields used in the Report are marked with a gray color under available fields, which makes it easy to clarify the fields used the Report.
The columns/Fields can be shown in original order (default) or sorted in alphabetical order and grouped into the types of field i.e. integer, date, text fields etc. (A-Z).
In the search box next to sorting checkbox it is possible to search for specific field names. Be aware that this search is case sensitive.
Any virtual columns (SQL Vars) that are available to use on the specific Report or data source will be shown as “Available Virtual columns” in the button of the Available fields list.
These fields can be used as any other available field, but will only affect the sql-statement sent to the server when actually used.
Details
Fields listed in this box will be shown in the table at the detail level. A field can be shown at detail level and grouped, calculated or filtered at the same time.
The first 20 fields in the table/view, which the Report is based on, are by default listed in the box “Details”. Those other fields that you wish to present on the list must be marked and moved from the “Available fields” to the “Selected fields” box by selecting Details and clicking [Add] or simply double clicking the field name. Fields can be removed by clicking [Del].
The order in which the fields are listed is also the order in which the columns titles are presented at the top of the list.
Use the [Up] and [Down] arrows to the left of the box to change the order.
Groups
By grouping data columns it’s possible to create Reports with collapse/expand functionality. By this is meant that it’s possible for the user of the Report to click on a group level to get a specification of the selected group.
From the list of “Available fields” you can decide which fields the list shall be grouped by. Those fields that you wish to group must be marked and moved to the “Groups” box using the [Add] to the left of the “Groups” box or simply by double clicking on the fieldnames in the “Available fields” box.
If you also want to present the fields on detail level, then move them from “Available fields” to “Details”.
There will usually be several fields that are relevant to group by, which is why the order is especially important.
The topmost field will form the first grouping level, followed by the subsequent fields from the list.
Simply pressing the [Up] and [Down] buttons to the left of the “Groups” box will change the grouping order.
When you group on more than two fields a “Level break” is automatically inserted after every two groupers. This level hierarchy is used to determine if the next detail level is opened as a “new Report” under the original. This can be useful in situations where you want to move between the detail-levels, or if you want to look at the details while keeping the overview.
The levels can be moved up and down in the same way as the data fields.
It is possible to work with up to 10 levels. Using hierarchies also reduces the server load, as each list is smaller.
Once you create more than one list level, Dynamic AI will automatically create the necessary drill down links on the calculated fields. It is necessary that at least one data-column is calculated.
By double clicking the groupers it’s possible to toggling between row grouping (blank), Column grouping and caption.
When Column grouping is selected, every unique value from the chosen field will be represented in its own column with its own column total. This format is typically used to present overviews by department, product, product group, month, quarter, year etc.
Column grouping might (depending on the data) create a very wide list. In such cases it’s recommended to group in rows and use the list hierarchy feature.
Column grouping are used to create “pivot tables”/ “cross tab tables” and another row grouper on the same level is therefore necessary.
Caption is used to combine the field with the row grouped field defined just above. This should only be used when having a one-one relation between the data in the fields.
This could be relevant if grouping on account number and account name, or other fields that “comes in pairs”. If you show account name with account number, you’ll get a list, correctly sorted on account number, but showing the account name on the same level.
More information regarding grouping in columns/rows is given in the section labeled ”List options”.
When activated the details will be shown on a new list. Otherwise they will be shown together with the lowest row grouper.
Totals
By calculating fields it’s possible to summarize or count values/units.
From the list of “Available fields” you can choose those fields that are relevant to calculate on.
The type of calculation is set by double clicking the field and toggling between “Sum”, “Count” and “Average”.
In this way you can create Reports with drill down functionality, where the user by clicking on the calculated value opens next level of the Report and get a specification of the value, see section “Locating reports”.
Under the tab ”List options”, you can find more information regarding calculations.
The number of decimals on integers are set by single clicking the field and typing 0-9.
Filters
By filtering data columns it’s possible to create Reports where the user set the filter value when working with the Report. In this way it’s possible to create Reports, where the user actual defines what to see.
From the list of “Available fields” you can choose those fields that are to be filtered. The type of the filter is by default set as a “Free Search” filter. By double clicking the field it is possible to change the filter to a “between” filter, where the user can type “from” and “to” values.
Under the tab “List options”, you can specify if the filter will be based on selection, free text, comparison, etc.
Depending on the users rights it’s possible to “Apply” the changes to the report without saving or “Save” the report (eventually as a new one), “Delete” the report or “Cancel” to return to the report without applying any changes.
Ad hoc change– Rights handling
Ad hoc change is a feature that gives access to simple design of a list. The user can (depending on rights) select between applying changes to a list without saving or actually delete, save or insert as a new report. When clicking “Save” or “Save as” on the Ad hoc change dialog box the box below is presented.
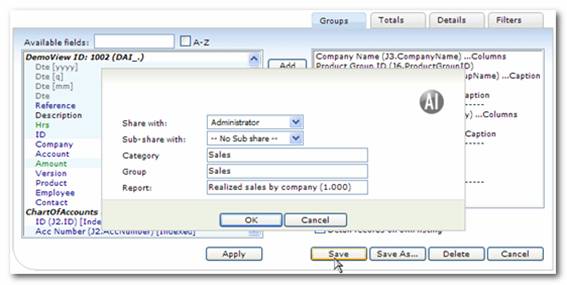
The group of users selected is the main user group that has access to the Report. It’s only possible to select user groups that the “Ad hoc change user” has the right to share information with. The “Ad hoc change user” needs to be owner of the report to be able to change which user group is selected.
Depending on the specific “Ad hoc change user’s” role (user, author or owner) it might be required to add a sub-share user group when inserting a new report.
Sub-sharing avoids users to design a Report from 1 user group and save the Report into another local group where members not necessarily have been members of the original intended user group of that particular Report. When a user is not part of the OWNER group of a Report - then a SUBSHARE (an additional user group to the original) must be specified. In that way Dynamic AI will validate that the new Report may only be used by users of the original intended user group in combination with the newly specified SUBSHARE group (or the author himself).
The fields determine the placement of the Report in the Report Menu. New categories and groups are established simply by typing the new names in these fields. To be able to see the Report the user needs to be a part of both the user group (share) and the sub user group (sub-share).
Sub-shares are a great opportunity to decentralize the developing of reports!
Below is a matrix showing that if the user of Ad hoc change isn’t owner of the report a sub share is required. It’s also notable that a user cannot update or delete a report without being a part of the owner group or the author.
|
User |
Author |
Owner |
|
Update |
NO |
YES |
YES |
|
Insert |
YES, with required sub user group |
YES, with required sub user group |
YES, with option to set sub user group |
|
Delete |
NO |
YES |
YES |