Reports are a key element in Dynamic AI. In this section the different Report types are discussed.
Note that the Dynamic AI Report is a highly flexible element that can be customized in many ways. Form based Reports (whether they are data bound or not) can include other Reports or elements such as lists, grouped lists, pivot tables, graphs, documents, graphics, sound or video files that can be linked to the data displayed on the form.
This is a list of the types of Reports available in Dynamic AI:
Non Data bound:
· Dashboard/Pages
· Link/URL
· Package (visual format depends on how it is used)
Data bound:
· Report
· List
· Graph
· List (Scrollable)
· Editable lists
· Interface/Export
· Form
Reports differs from an ordinary document/printed report by being generated dynamically from a combination of the design and the data from the underlying database as it is at the moment a user makes a request.
There are ways of preventing Reports from querying the background database at every request. This is relevant when queries are complex and time consuming for the database backend, when data are not modified often or when it’s desirable that users see the same set of data even when requesting the Report at different times.
The “pre-caching” option in the Report definition makes this possible.
When “pre-caching” is used, Reports display the “age” of the data included and let users update the cached data.
The Dynamic AI Agent can be set to automatically update the cached data at regular intervals. Learn more about pre-caching in the “Owner rights” section.
Because Dynamic AI provides presentation, layout, functionality and content dynamically, a very high level of validity (as both data and design will be up-to date) is ensured.
Dashboards/Pages are simply containers for other content. Items that can be included on blank pages are the same as for data bound forms, with the exception of data elements and related data bound Reports. Items that may be placed on a blank page include
· Custom texts
· Graphics
· Links to Reports
· Reports
· External content
· Packages (will be displayed as a list of hyperlinks to package content)
A link/URL page is a reference to an external web page. The actual page (not only the hyperlink) is opened in the Dynamic AI Presentation Area.
Packages are a named set of hyperlinks to other Reports. A package can also be a named set of hyperlinks to other packages.
Packages can be used on a form or a blank page as a list of hyperlinks to the included Reports or as a toolbar presented in the top of the Dynamic AI screen.
A report will show grouped and aggregated data eventually with the opportunity to filter on various dimensions. Typically it will include drill down all the way to the specific transactions and might have a form presentation of each record. A Report can include a Graph presentation of the figures.
A report will include a header (i.e. company logo) when applied on the style sheet used on the report and a footer holding information of creation date, user, report naming and location information, as well as a report stamp.
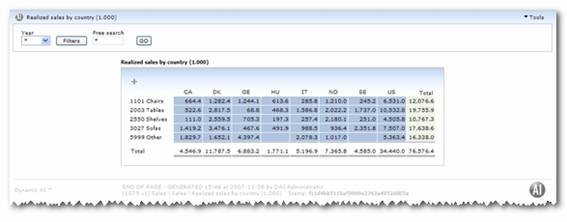
An example of a report would be a pivot table or a “cross tabs” where data has been grouped both horizontally and vertically and calculations appear as the cross between the horizontal and vertical groupings.
In the sample pivot table below, countries are grouped horizontally, while product groups are grouped vertically. Sums of revenue by product group by country are shown in the pivot table.
Clicking the numbers themselves drills down to specific revenues for that specific product group and country. It is also possible to drill down from horizontal or vertical totals.

Pivot table Report definitions can also include more totaling features, such as accumulations, aggregations etc. It is also possible create comparable pivot tables. For instance, a pivot table could be set to list data from 2 different years.
The only difference from a Report is that a List won’t include a header and footer as described above regarding Report.
Business graphics are presented using information gathered from the list definitions groupings and calculations.
A graph can be shown by itself, or along with any list type.
Graph style sheets define graph styles.
Below is an example of a report with its corresponding graph.

The business graphics in Dynamic AI rely on an ActiveX component that is loaded onto connecting client computers automatically. Users connecting from browsers that does not support ActiveX controls, can still view graphs, as they will be displayed as images.
A Scrollable list presents data in easy to read table format.
Scrollable lists provide a set number of rows at a time and provide a way for the user to navigate (scroll) to see more data.
Lists can be scrollable or non scrollable.
Non-scrollable lists display the full data set as one list. However, there is a maximum number defined in the Report. This default maximum is 300 rows. The maximum setting works as a limit to ensure that queries resulting in very long lists cannot be executed unintentionally. Non-scrollable lists that exceed the set limit will automatically become scrollable.
Scrollable lists can include various grouping levels, calculations and filters.
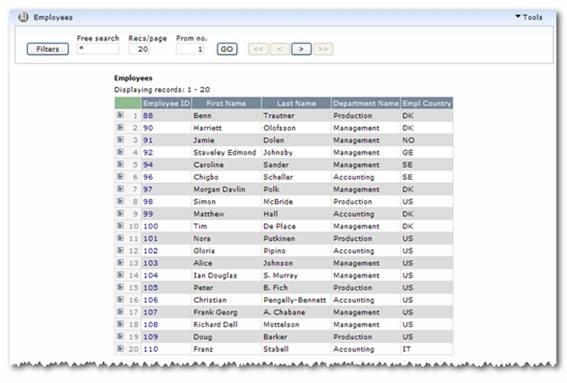
The number displayed in the leftmost column can serve as a shortcut to detail data displayed on a form, to a different related Report or is disabled.
Below is a sample list:

Editable lists are similar to other lists, with the main difference being that users can modify, add or delete rows.
Users navigate among the different editable fields using the mouse or keyboard (see Keyboard shortcuts section). Fields can be marked read only.
The Report definition can include read only fields, fields rendered as combo boxes (to let users pick data from a drop down box such as Employee number rendered as a list of available employee names) and various rights for making it possible to limit list editing operations to inserting new data, or updating existing data.
The Interface/export type will return all records for advanced file exports. The list is typically a detailed list without groupings and calculations, and should include all records meeting the criteria’s set on the report.
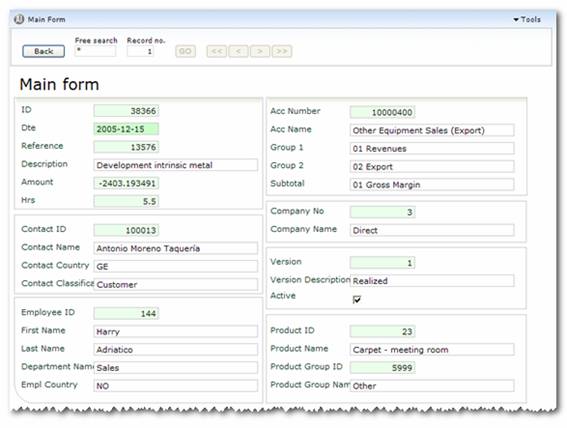
The form is a representation of a single database record. Forms are often used to gain a detailed view of a record, when the complete record is too large to fit on a list.

Forms can be read only or updateable depending on user permissions and the underlying database.
Items that can be inserted on a Dashboard/Page can also be inserted on a form.
In addition, forms can display other Reports linked from the data appearing on the current displayed record.
For example the form used to display detailed customer information can also host the Report showing the outstanding invoices automatically filtered for the customer currently displayed on the form.
When displaying other Reports on a form, it is possible to override the inserted Reports default view. For example an inserted Report designed to be a list and graph Report, can be inserted as either the list and graph or the list or the graph alone.
Forms can also display content defined by the data on the form. Examples of this could be:
· The employee table includes a field that references to a photo of the employee. The Dynamic AI form Report definition can be set treat the field as a link to the image or to display the image directly on the form itself
· The customer database includes email addresses of the customer contact or the customer web site homepage. Dynamic AI can treat this information accordingly and display the customer homepage inline on the form or provide a link to email the customer directly from the form.
· A transaction table includes references to scanned invoices. Dynamic AI can display the invoice image directly on the form, or provide a link to the image.