
There are different ways to open a Dynamic AI report in Excel. Below are shown the different possibilities and settings that can be used.
· Open in Excel
· Open linked in Excel
· Open filter page in Excel
· Link for Filter page
· Grouped values on each row
· Include drill-out
When clicking on “Open in Excel” a copy of the report is exported to an Excel spreadsheet.
The first dialogue that is shown after clicking this menu item is a File download dialogue.
Here you can either select to save the file or open it right away.
If you decide to open the report Microsoft Excel will start and the report will be shown in excel.
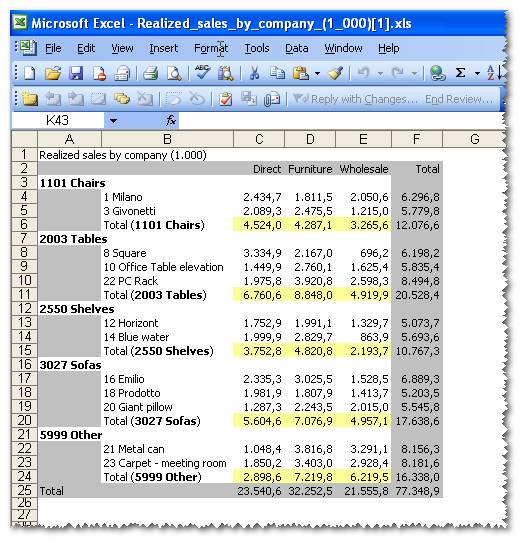
As shown above you can see that a standard style sheet will be used when exporting. Also not that report will be shown fully expanded when exporting it into Excel.
Another way to open a Report in Excel is to link a spreadsheet to a specific report in Dynamic AI. This will give an opportunity to have Excel spreadsheets with active and updated Dynamic AI reports.
By clicking the menu item “Open linked in Excel” the following file download dialogue will appear:

As you can see above Dynamic AI have generated an .iqy file which can be linked from excel.
Select “Save” and store the .iqy file for later data import or click open to see the result right away.
If you click Open the next dialogue you will see is verification for trusted files.

When you click “Open” the you will be asked for Dynamic AI user and password.

Input username and password. If you want to reuse this user ID and password each time the report is refreshed click “Use this value/reference for future refreshes”.
If you decided to save the .iqy file simply open excel and select “Data/Import External Data/Import Data” as shown below

Locate the .iqy file and select placement and type username and password as described above.
If underlying data changes and you wish the new changes to take effect in Excel you will have to update the imported sheet manually.
The updates are done by right clicking anywhere on the imported Report (You need to be on the imported information) and choose the menu item “Refresh data”
The imported data will now be updated and reflect any changes made to the Report from within Dynamic AI.
If the report you want to link to from Excel includes various filters the linking is a two-step procedure.
First you want to create a Excel spreadsheet with the report filters. This is done by selecting “Open Filter-page in Excel”.
After this you will see the following dialogue:

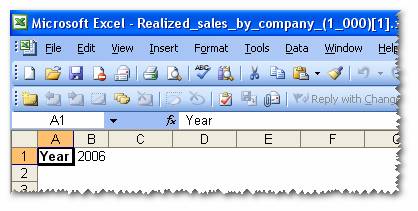
Select “Open” and you will have a spreadsheet with filter names and eventually filter values if any was set on the report before clicking “Open Filter-page in Excel” as shown below:
Step two is to generate a .iqy file including information about filters by activating “Link for Filter page” in the Dynamic AI Tools menu.
After you have generated a Excel Spread sheet with filter information you need to generate a .iqy file to link Excel with.
Click “Link for Filter page” and save the file.
Open the Excel filter page (generated in step one) and select “Data/Import External Data/Import Data”
When asked for filters simply point the cells holding the filter values and activate “Use this value/reference for future refreshes” and “Refresh automatically when cell value changes”

You have now created a linked Dynamic AI report in excel with filter boxes, that whenever filter values changes will refresh the report with the defined filters:

Note that if the filter type is a free search filter you can use the same operators as allowed when using the report within Dynamic AI (i.e. <,>,<>, “in ” and “..”). Read more about the use of operators in “Viewing/Selecting data”.
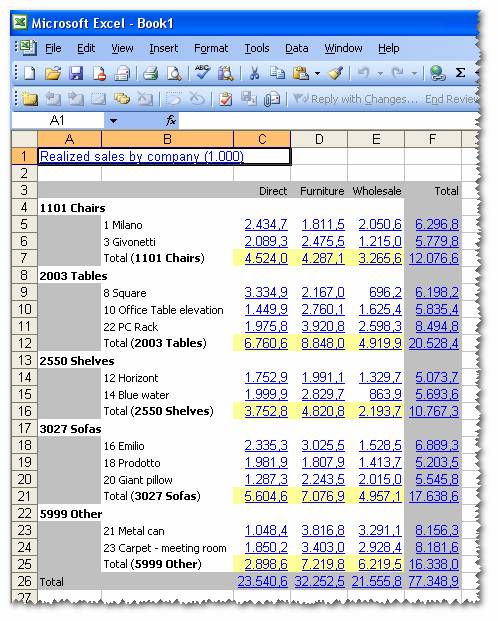
By default a report exported to/linked in Excel will show row groups in the same way as in Dynamic AI (see below).

Sometimes it is however better to have a “table look” when using Excel functionality to lookup values in a range.
When activating “Grouped values on each row” the same export/link will look like:

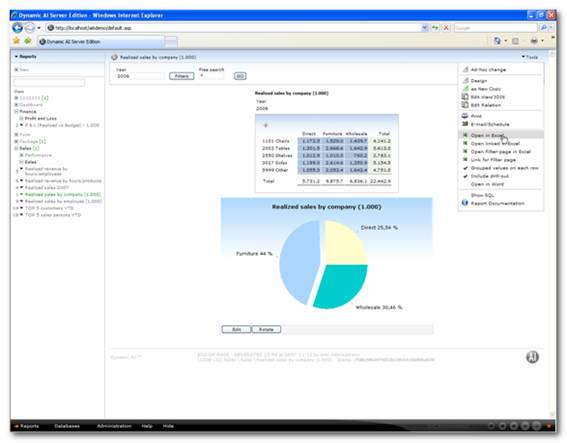
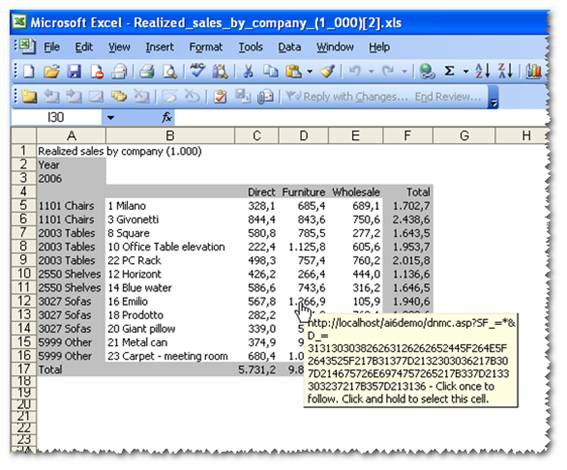
By default drill-out is activated on whenever a Dynamic AI report is exported to/linked in Excel. This means that any place where a drill down was possible in the Dynamic AI report, it possible to click on the figure in the Excel spreadsheet. After clicking on a figure the drill-out will be shown in the browser, giving the user the exact specification of that figure as exemplified below:
Step one – Open in excel
Step two – drill out from Excel
Step three – the result shown in the browser:

If the user wasn’t logged into Dynamic AI a normal login screen should be passed before the drill out would be presented.
When deactivating “Include drill-out” only the figures will be shown in the spreadsheet and any drill-out information will be disabled.