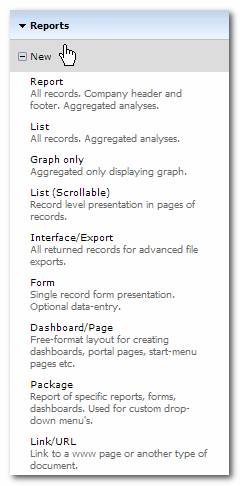
You can design a new report by selecting the type of report under “New” in the Report menu. This can be data bound reports as described in the section “Creating data bound Reports” or it can be Non-data bound reports (as i.e. packages, URLs, dashboards).
How to create the different kind of reports will be described below.
A report will show grouped and aggregated data eventually with the opportunity to filter on various dimensions. Typically it will include drill down all the way to the specific transactions and might have a form presentation of each record. A Report can include a Graph presentation of the figures.
A report will include a header (i.e. company logo) when applied on the style sheet used on the report and a footer holding information of creation date, user, report naming and location information, as well as a report stamp.
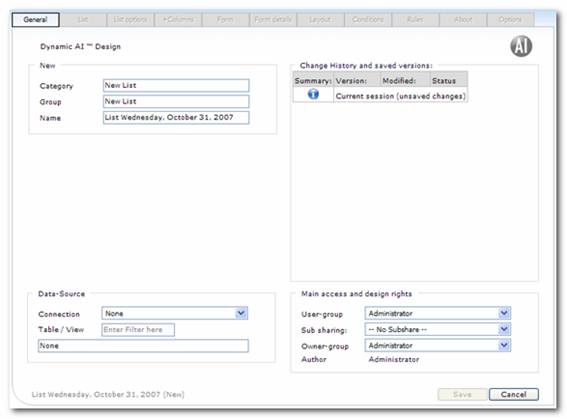
After selecting Report, the following screen will be shown in the presentation area:
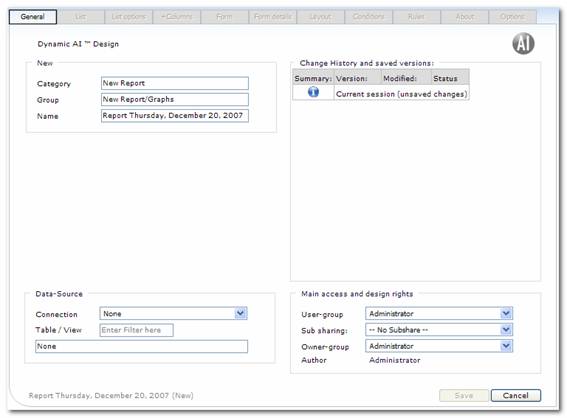
You can assign name and grouping information to the report, and the main access and design rights.
Before you can start defining list and form layout you need to specify the Data-source that the report will be based on. This is set by selecting connection and then a table/view from that connection. A view can be a view stored on the connection or a Dynamic AI JOIN or a Dynamic AI SQL View stored in Dynamic AI’s repository.
You can use the box next to “Table / View” to search for relevant data-sources or you can click on box in the bottom to get a full list of the tables and views related to the chosen connection.
After successfully selection of data-source you will have access to the rest of the tabs presented in design mode as shown below:
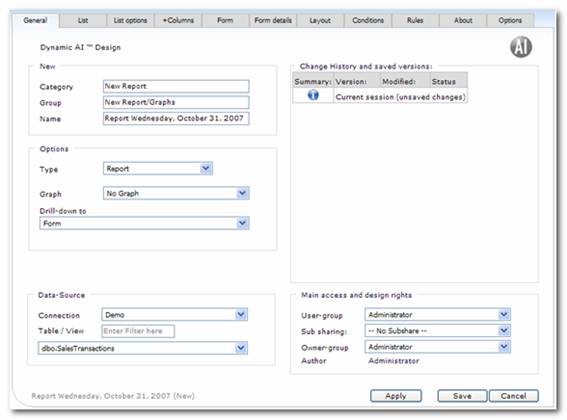
To learn more about creating reports please read the section “Creating data bound Reports”.
A list will show grouped and aggregated data eventually with the opportunity to filter on various dimensions. Typically it will include drill down all the way to the specific transactions and might have a form presentation of each record. A List can include a Graph presentation of the figures.
The only difference from a Report is that a List won’t include a header and footer as described above regarding Report.
After selecting List, the following screen will be shown in the presentation area:
The workflow will follow then flow described above regarding creating a report. To learn more about creating lists please see the section “Creating data bound Reports”.
You can select that the presentation only will include a graph. You still need to define groupings, calculations, filters etc. that the graph will be based on.
This is done by selecting a Data-source and then designing what to be presented in the graph. Please see the section “Creating data bound Reports” to learn more about creating Graphs.
A scrollable list will show a record level presentation in pages of records. By default 20 records will be shown on each page, but it can be changed when designing the report.
Please see the section “Creating data bound Reports” to learn more about creating Scrollable lists.
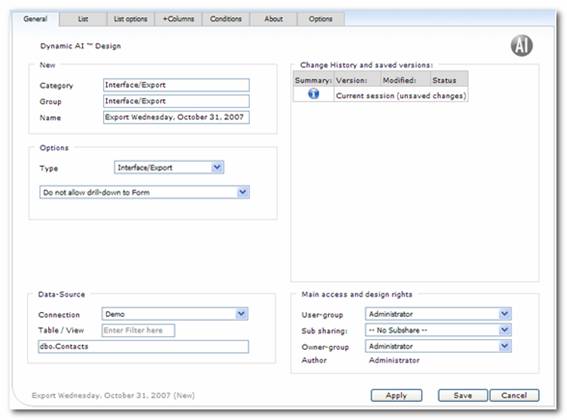
When deciding to create a list that will be used for export this is a good starting point. The Interface/export type will return all records for advanced file exports.
After defining the data-source you will see that only relevant tabs for exports lists are available.
Please see the section “Creating data bound Reports” to learn more about creating lists.
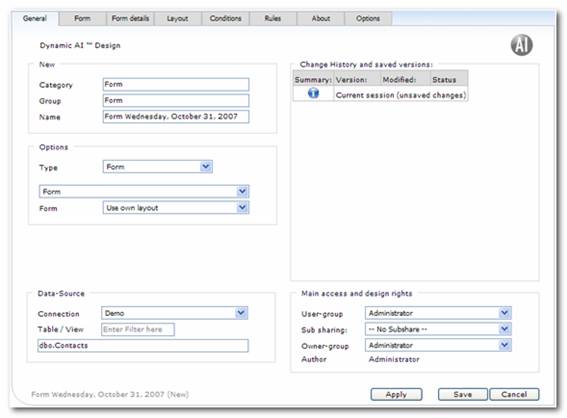
A form is a single record form layout presentation, eventually with data-entry functionality included.
After selecting the data-source you will see that only relevant tabs for forms are available.
Please see the section “Creating data bound Reports” to learn more about creating lists.
A Dashboard/Page is a free-format layout. In many cases a page can be useful. For instance to present more than one Dynamic AI Report together on the same screen (“Start” pages, “Today” pages, “Dash boards” etc.) or to give free possibilities of designing work flow applications with links to relevant Reports used in the particular workflow.
By clicking “Dashboard/Page”, the Design module for pages is shown.
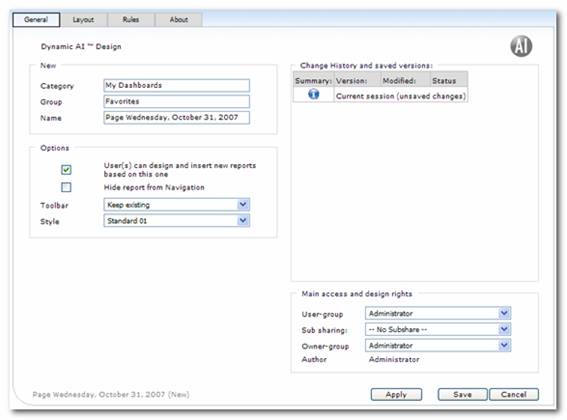
Differently from designing “Data-bound” reports is that you don’t define a data-source. Relevant tabs for designing a Dashboard/Page are:
· General
· Layout
· Rules
· About
The tabs will be described below:
Under the “General” tab, the possibilities for naming and access rights are set.
The fields Category, Group and Name determine the placement of the Report in the Reports Menu. New categories and groups are established simply by typing the new names in these fields. Categories and groups are deleted if they no longer contain Reports.
The menu hierarchy items such as “Common” and “Own” have 3 levels in categorizing and grouping:
· Category - the broadest classification of a Report.
· Group - a set of Reports, which are found under one Category
· Name - lists all Reports that are placed in one Group.
The Reports Menu is by default showing the first level of the menu hierarchy, where the possibilities are common/own, user group, owner, author, type, style, database connection and data-source.
By clicking the menu item the Categories in the selected Item is shown. Clicking once on the Category name will allow you to see all the Groups under that Category. A single click on a Group name will then allow you to see the Reports saved in that Group.
This is used to give users of the Report access to save changes when designing the Report.
When a Report is inserted it will automatically appear in the Navigation Menu in the left side of the screen. If you don’t want it to be shown here, you can click on the “Hide Report from Navigation” to make this feature active. To actually force the report to be shown “Include Hidden” has to be set on the individual users Report menu.
A toolbar is an alternative menu shown in the top of the Dynamic AI screen.
A toolbar is based on packages (grouping of Reports created under “New/Package”). If you chose to keep the existing package when showing the Report, the package shown to the user before opening this Report isn’t deleted.
Using toolbars are a good way of creating user-friendly workflow applications within Dynamic AI.
A Report can be presented using any of Dynamic AI’s standard formats or using a user-defined format, which is discussed in the “Style maintenance”. In this way, one department, one team, or one company can achieve unity and consistency in the appearance of its Reports.
Dynamic AI automatically suggests the style, which is chosen as the standard style for the database link. If another style must be used, simply choose this other style from the list of possible styles.
Please see “Creating data bound Reports” for a description of versioning.
This is where you define which user group that has user access to the Report and which group that has ownership access.
Individual user rights are set below.
Note: Once you grant ownership rights to others, they can modify and even delete your Report. They can also change the Report so you do not have access to it anymore.
Please see “Creating data bound Reports” for a description of access rights and design rights.
When the “Layout” tab is pressed, a blank sheet is shown. Be aware that this tab is only available when working in Internet Explore (IE) since drag-drop is not implemented for other browsers than IE.
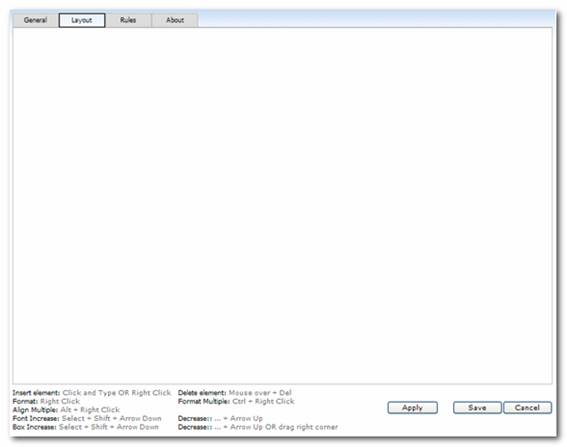
Now it is possible to write texts anyplace on the page. When the text is written, its color and font can be changed simply by right clicking on the element (text or box).
By right clicking a text field, you get the Format dialog, where you can set fonts and color options for the particular text or text field.
You can choose the font, font size, weight, alignment, color, background color and border.
Another way to change the font size is to single click the text and then use up/down arrows while pressing [shift].
Holding the left mouse button down and moving the mouse to the right create a rectangle. This function is used both to make boxes, which later can be colored, and to highlight several objects on the page, which can then be moved as a group.
By right clicking on a blank area of the page, you will see a dialog box that allows you to insert various objects. You can choose among
• Line
• Image (picture in jpeg, gif or a similar format)
• www (presentation of link in I-frame)
• Doc (only used on data bound forms)
• Report (other Dynamic AI Reports presented in I-frame or as a link)
To delete an element, select it by single-clicking it, then delete it by pressing the [Delete] key.
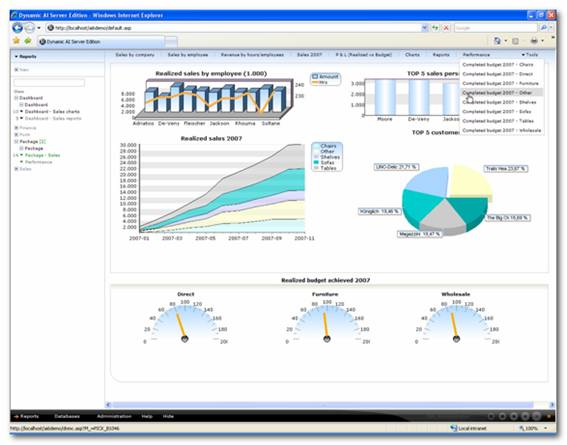
The following is an example of the layout mode of “Dashboard/Page”, where different objects (a text, Dynamic AI list and graphs) are included:
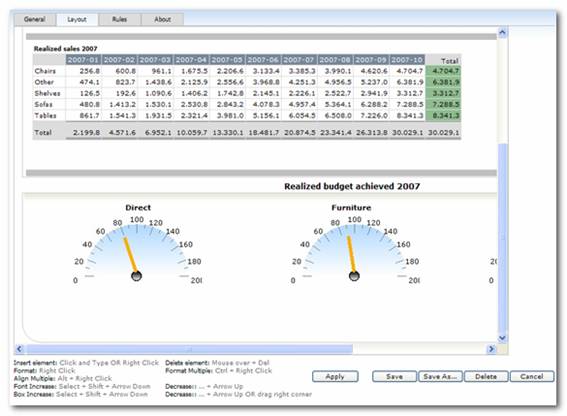
How to work with the Layout is further described in the chapter “Customize data bound Reports/Layout”.
The Rules-tab provides an input box where custom client-side JavaScript can be entered.
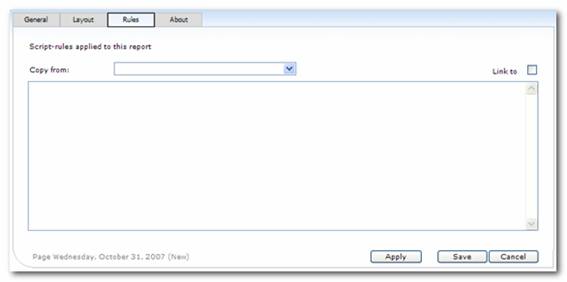
The script entered her will be included on the Report (Dynamic AI prefixes the script with the HTML tag"<Script Language=JavaScript>" and suffixes with the HTML tag "</SCRIPT>").
Dynamic AI in does not validate the script entered here.
The ”About” tab provides a space to describe the Report. This could be a short instruction to the user, or a message indicating that the Report is work-in-progress.
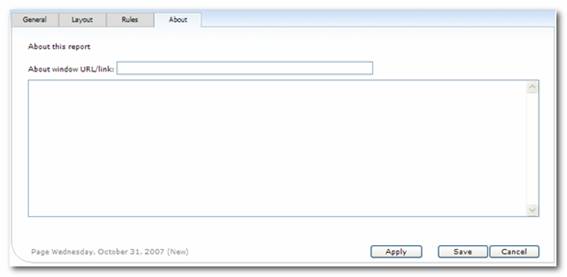
The about can be set up as a link to another site or by entering the text in the window below. By including a link in the “About window URL/Link” or a text the users will see the about page presented when they select about either by clicking next to report name in the report menu or selecting about in the tools menu.
A package is a grouping of different Reports. Packages can be useful when creating alternative access to Reports i.e. when using Reports in certain workflows across the normal grouping presented in the Navigation Menu.
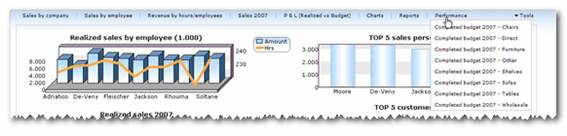
Packages can be presented either on a page or in the Information Bar (like a menu tab) in the top of the screen as shown below.
A package is an alternative grouping of the Reports. When creating a package you get the opportunity to select various Reports to be grouped.
Afterwards when using a package in another Report a new menu is shown in the top of the Dynamic AI screen. This is another way of building a user-friendly application within Dynamic AI.
If a package includes other packages the result will be drop down menus in the information line.
When ”Create Package” is selected, a page appears like shown below:
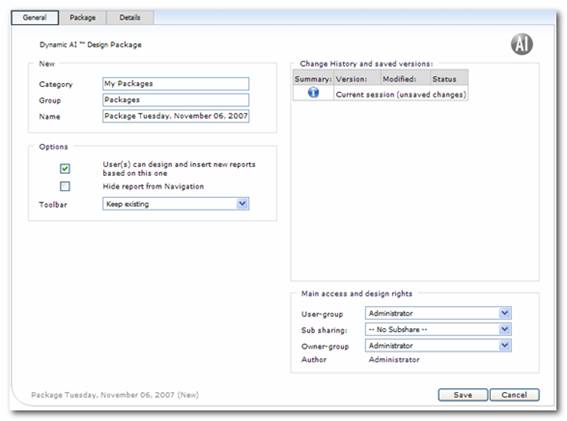
You can now name the category, group and Report for this package. This determines where the package will be saved in the navigation menu. And you can define options and main access and design rights as well as work with earlier versions via the change history. (These settings are discussed in further detail in the chapter “Creating data bound Reports”.)
Under the tab “Package” it is as shown below possible to select which Dynamic AI Reports that is to be included in the package.
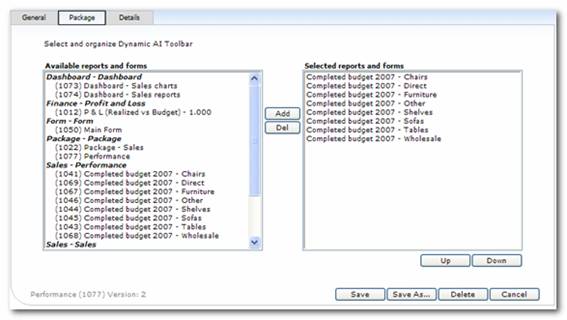
Simply select the wanted Reports by clicking them and then press the Add button (or Del to delete) between the two boxes.
The order of the links is changed by the buttons [Up] and [Down].
Under the tab “Package Details” it is possible to change the name of the caption to be shown in the package.
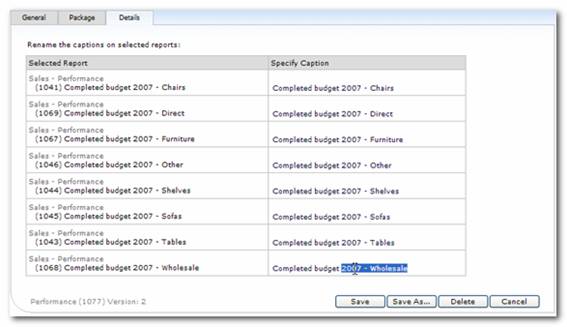
Typing the new Caption in the column “Specify Caption” changes the name.
Below is shown an example, where a package is inserted on a “Page” allowing the user to jump directly to the Report by clicking on the links shown in the top of the Dynamic AI screen.
For more information of using packages in data bound Reports please see the chapter “Toolbar”.
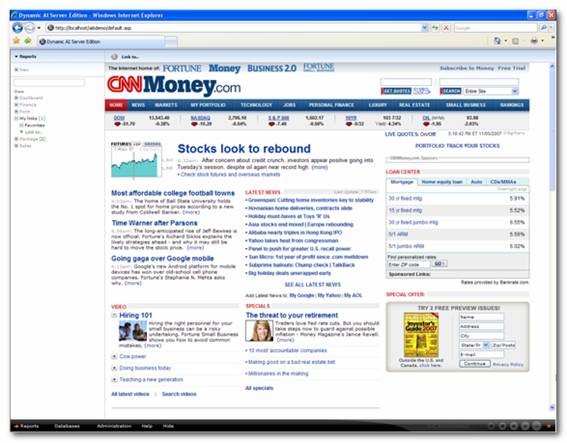
A link is used when you want to present a Word document, pdf file or a HTML in Dynamic AI.
By clicking “Create Link”, the design module for links is shown and it’s possible to insert the link as a Report.
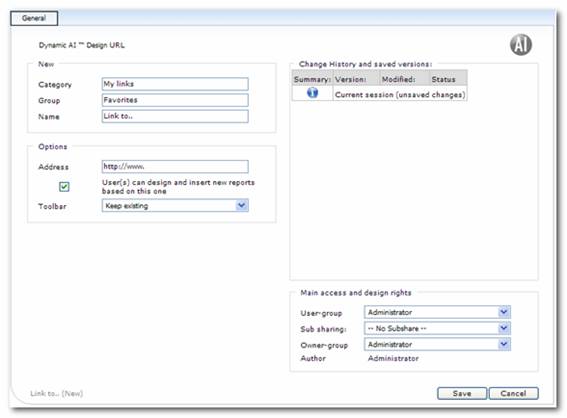
You can now name the category, group and Report for this link. This determines where the link will be saved in the navigation menu. On this tab you also define options and main access and design rights as well as work with earlier versions via the change history. (These settings are discussed in further detail in the chapter “Creating data bound Reports”.)
The Internet address of that link you wish to present should be stated in the “Address” field.
It is also possible to list addresses of documents you wish to present via Dynamic AI. These could be PowerPoint, Word or Excel files, for example.
Please remember that the path to the file is relative to the Dynamic AI Server, not the client workstation.
When the Report is inserted it will automatically appear in the Report menu in the left side of the screen.
The Report is saved by pressing the “Insert” button in the function line at the bottom of the Dynamic AI screen.
The following is an example of a presentation of a Dynamic AI link to CNNMoney.com: