X-axis=Columns Values=totals
X-axis=Rows Values=totals
X-axis=Columns series=rows
X-axis=Rows series=columns
This document provides samples and explains the 4 different types - the report shows the same data in all cases.
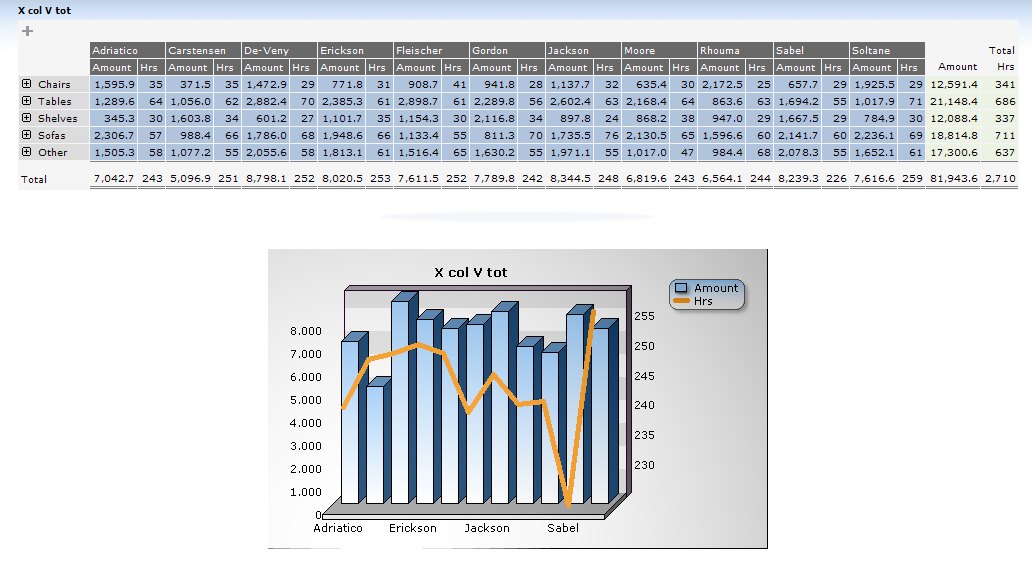
X-axis=Columns Values=totals
This option shows the column-grouped data on the x-axis, and the calculated total for each column as data.

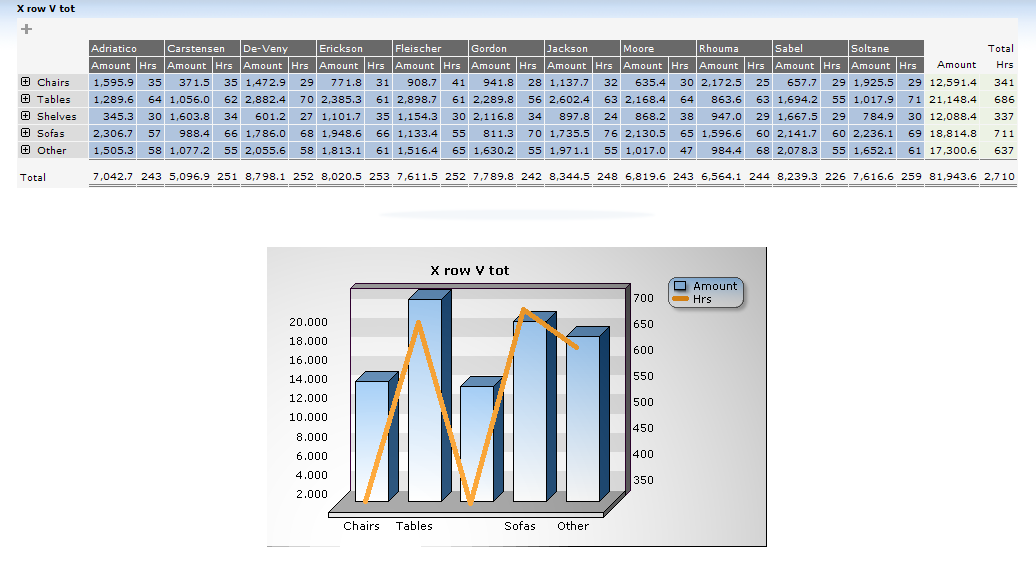
X-axis=Rows Values=totals
This option shows the row-grouped data as the x-axis, and the calculated total for each column as data.

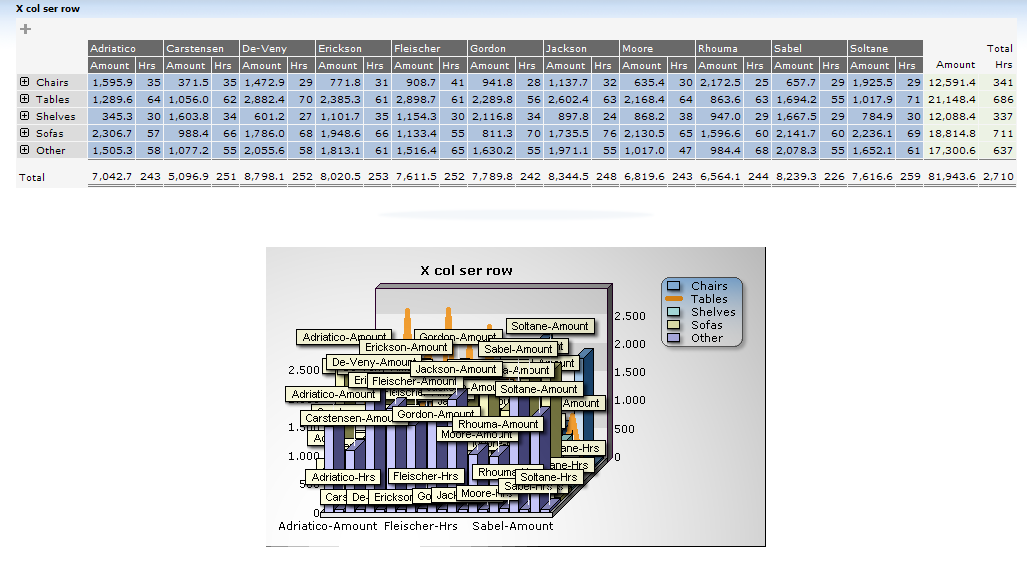
X-axis=Columns series=rows
This option shows the column-grouped data on the x-axis, and the value of each cross-tabbed sum as data.

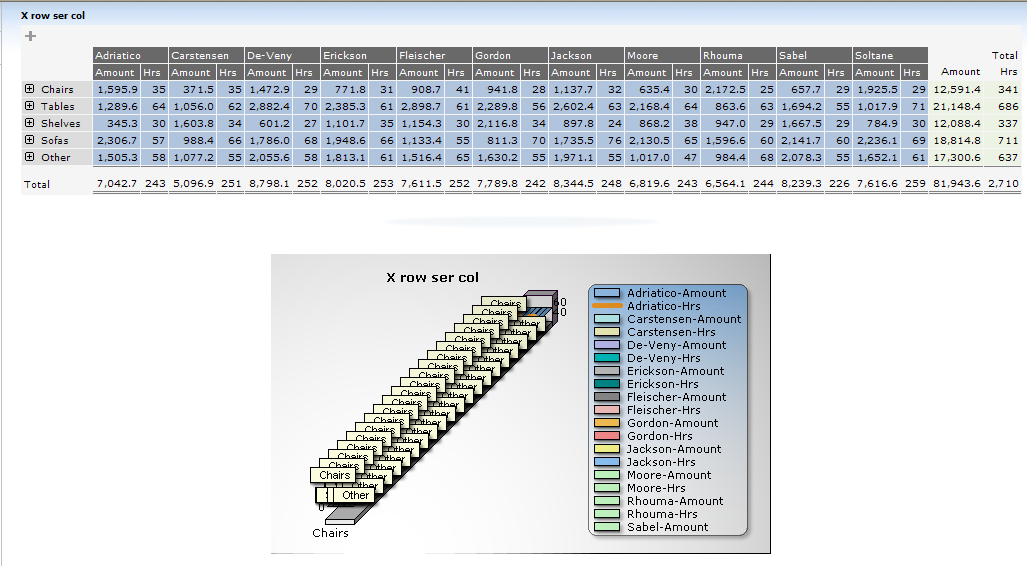
X-axis=Rows series=columns
This option shows the row-grouped data on the x-axis, and the value of each cross-tabbed sum as data.


