+ Columns

Technical support

Moderators: Bob Cergol, Data Access, Cintac

+ Columns

Postby Mauricio » Tue Aug 05, 2008 12:35 am

Hi DAI Team Support

I have a problem with a "+ Columns" section. The query don't show extra column, perhaps because is a subquery.
The report is based on Dynamic View
Code: Select all
SELECT repindi.*, CONCAT (repindi.periodo, detvali.descripcion) AS fecha FROM repindi INNER JOIN detvali ON repindi.periodo=detvali.dato WHERE (repindi.cve_grupo = 1) AND (repindi.cve_indica = 1)


In "Extra column and key-figure calculations" section, I give the next query
Code: Select all
SELECT SUM(repindi.valor)/3  FROM repindi WHERE repindi.periodo BETWEEN 200705 AND 200707
as Integer SQL. Extra column not appear.


Best Regards
Mauricio
 
Posts: 4
Joined: Fri Aug 01, 2008 12:33 am

Postby Carsten Sørensen » Tue Aug 05, 2008 11:57 am

Hi Mauricio,

Can you try adding a simple +Column e.g. just
valor/3 as the formula?

Dynamic AI will do the SUM() automatically.

If you need the WHERE condition on the subselect column only you might have to move the column definition to the Dynamic AI SQL View instead like:

SELECT repindi.*, CONCAT (repindi.periodo, detvali.descripcion) AS fecha,
(SELECT SUM(repindi.valor)/3 FROM repindi WHERE repindi.periodo BETWEEN 200705 AND 200707) AS SUM2
FROM repindi INNER JOIN detvali ON repindi.periodo=detvali.dato WHERE (repindi.cve_grupo = 1) AND (repindi.cve_indica = 1)

Depending on your background DB engine that might be possible.

Please consider that the fixed conditions (200705 and 200707) might be better to filter at report execution time - i.e. you might benefit from not including the condition as a fixed part of the report definition - but put a filter on the column instead for online specification.

FYI: The Server and Enterprise editions of Dynamic AI will allow for redirection of the online filter input into the Source of the Dynamic AI view. I.e. you will be able to parameterise the SQL.

best regards
Carsten
User avatar
Carsten Sørensen
Certified Dynamic AI Professional
 
Posts: 304
Joined: Thu Aug 16, 2007 1:25 pm
Location: Copenhagen

Postby Mauricio » Wed Aug 06, 2008 2:05 am

Hi Carsten,

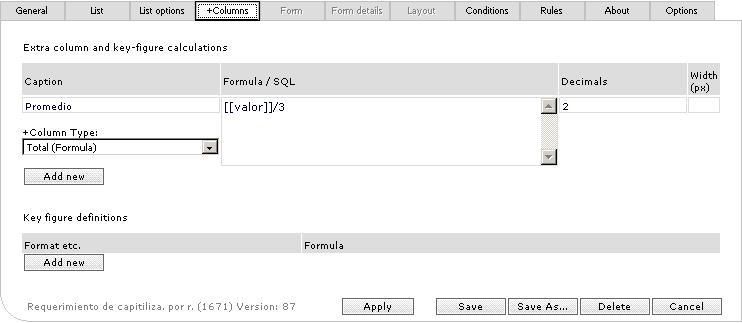
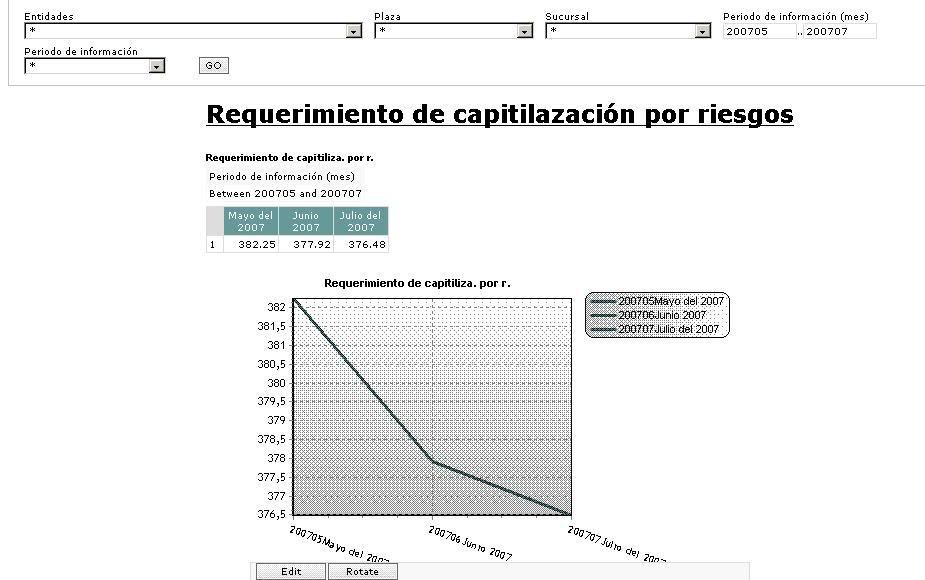
I have tried add valor/3 as formula but not appears in Report the +Column.
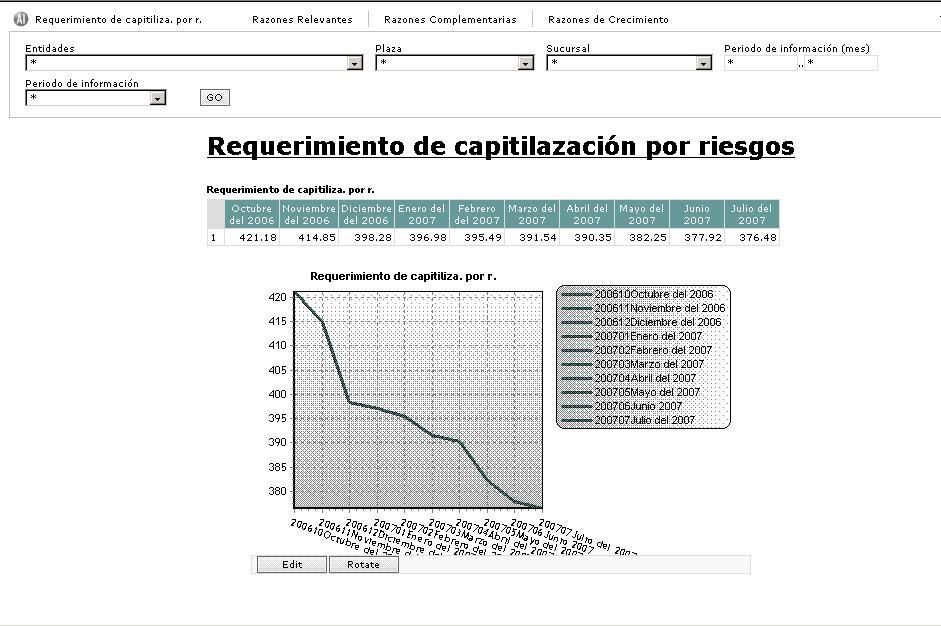
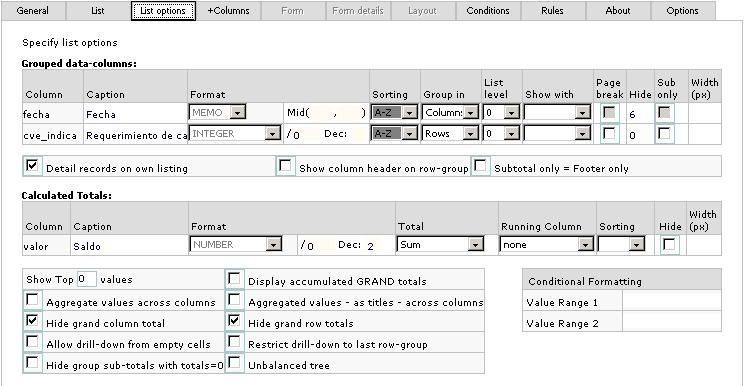
This is my report:
Image
Image
As you can see in Calculated Totals, "valor" takes the caption as "Saldo"


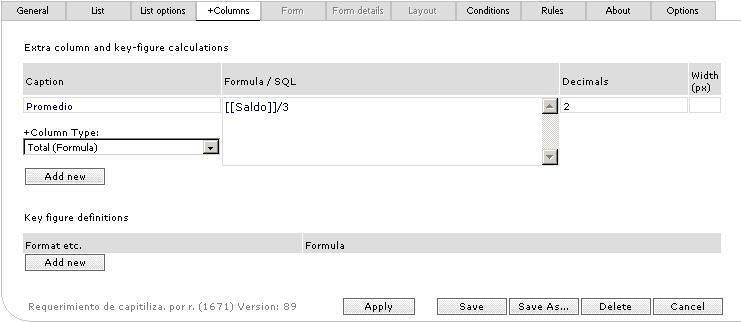
I have tried different ways to declare the formula, still unsuccessful.
Image
Image


This is the filter report for real value column
Image
I.e. I would like see 12 months and the +Column (which average formula contains)


Thanks for your support
Best Regards
Mauricio
 
Posts: 4
Joined: Fri Aug 01, 2008 12:33 am

Postby Mikkel Jensen » Mon Aug 11, 2008 2:01 pm

Hi Mauricio

Your graph is based on a report that is a cross tab table. Unfortunately can ”Total (Formula)” type of extra columns only be used on row grouped reports.

I have created a report similar to yours to show you an alternative solution that I hope you find useful:

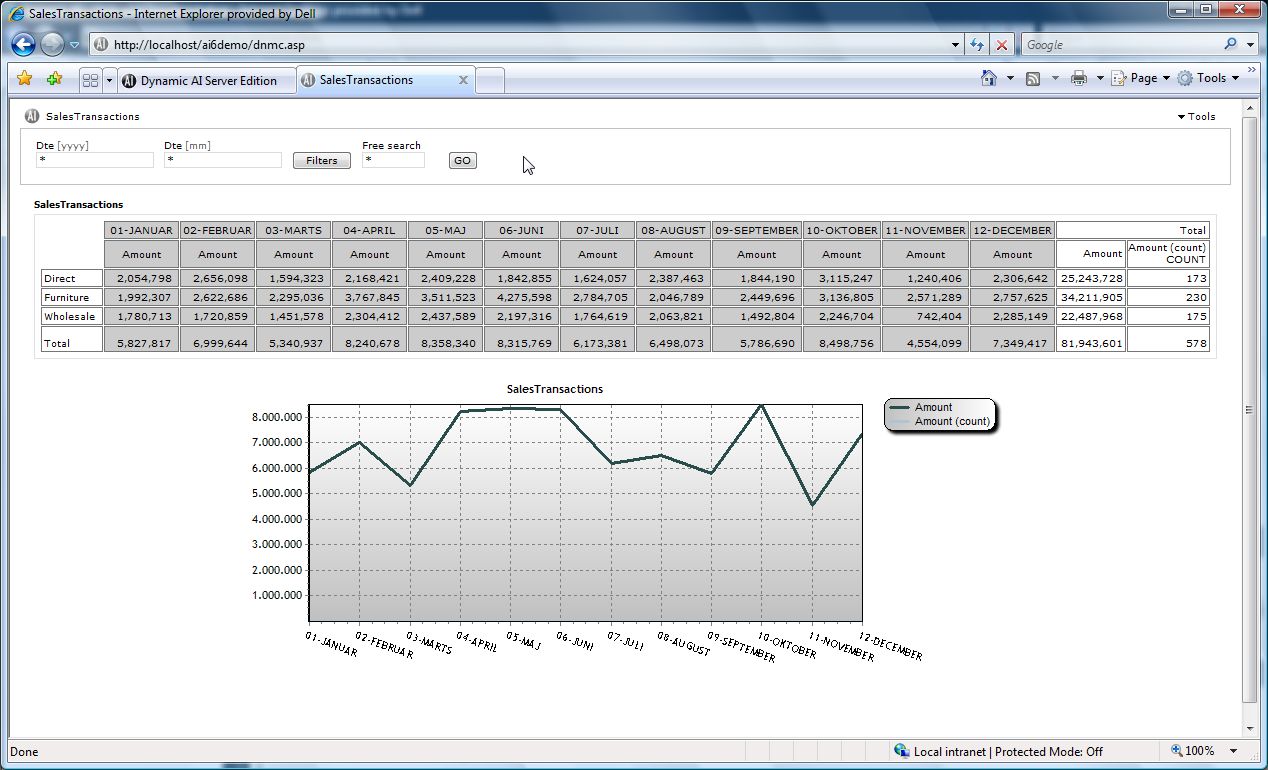
Image

First you need to change your rights on the user profile to be able to maintain style sheets

Image

After Exit and new login you will be able to save new Chart templates based on other templates (Available in Server and Enterprise Edition from Version 6.1)

Image

Change the report to the newly saved template

Image

Save and run the report. Click Edit and clone the serie:

Image

And change the serie to an average function based on the calculated figure:

Image

Eventually change color and name:

Image

Image

Unfortunately there is a little issue that requires that you include the amount (in your case “Valor”) two times on the report in order to get the average serie shown...

Image

Image

Image

And the average calculation will change as you change the periods shown in the report

Image
Best regards,
Mikkel
User avatar
Mikkel Jensen
 
Posts: 44
Joined: Fri Sep 21, 2007 1:41 pm
Location: Copenhagen, Denmark

Postby Mauricio » Tue Aug 19, 2008 8:35 pm

Hi Mikkel

I have Dynamic AI 6.0 version, and many graphic options don’t appear.
If you add a list like a Report (graph included), this takes the average value in each column list and totals.
I’m only interested in the total average.
How I can hide the other average columns?


Thanks a lot
Best Regards,
Mauricio
Mauricio
 
Posts: 4
Joined: Fri Aug 01, 2008 12:33 am

hide series in graph

Postby Mikkel Jensen » Wed Aug 20, 2008 1:18 pm

Hi Mauricio

The easiest way to hide series in the graph is to uncheck the specific series when you edit the graph template.

Image

In the list presentation it is unfortunately not easy to hide a part of the columns. I'm not sure if this is what you want, but it can eventually be done via the list style if your report is relatively fixed in the format?
User avatar
Mikkel Jensen
 
Posts: 44
Joined: Fri Sep 21, 2007 1:41 pm
Location: Copenhagen, Denmark

Postby Mauricio » Sat Aug 23, 2008 2:34 am

Hi Mikkel,
I appreciate your help


I'm refer to columns of list, like that
Image
I only care "Total average"
Image


But as well interested me the graph with "Amount" and "Amount average".


Thank you for your help
Best Regards
Mauricio
 
Posts: 4
Joined: Fri Aug 01, 2008 12:33 am

Postby Mikkel Jensen » Wed Aug 27, 2008 1:16 pm

In the style sheet you can address specific columns via #collx.

But be aware that the below suggestion will help you on the first level of the report and might mess up the next levels. you should therefore not allow drill down on the report or at least do it related to another report using another list style. The next thing is that it is a very "fixed" way of styling the report and should therefore be maintained as the report might grow in future (new month’s appears).

What I did was copying the standard styles sheet Std12 into a new style sheet and changing the part regarding #collx :

#coll3,#coll5,#coll7,#coll9,#coll11,#coll13,#coll15,#coll17,#coll19,#coll21,#coll23,#coll25
{display:none;}

#coll2,#coll4,#coll6,#coll8,#coll10,#coll12,#coll14,#coll16,#coll18,#coll20,#coll22,#coll24
{background-color:#cccccc;padding-left:10px;padding-right:4px;}

Please note that you might need to delete some of the #coll definitions until the report have 12 months.

Image
User avatar
Mikkel Jensen
 
Posts: 44
Joined: Fri Sep 21, 2007 1:41 pm
Location: Copenhagen, Denmark


Return to Technical Support

cron