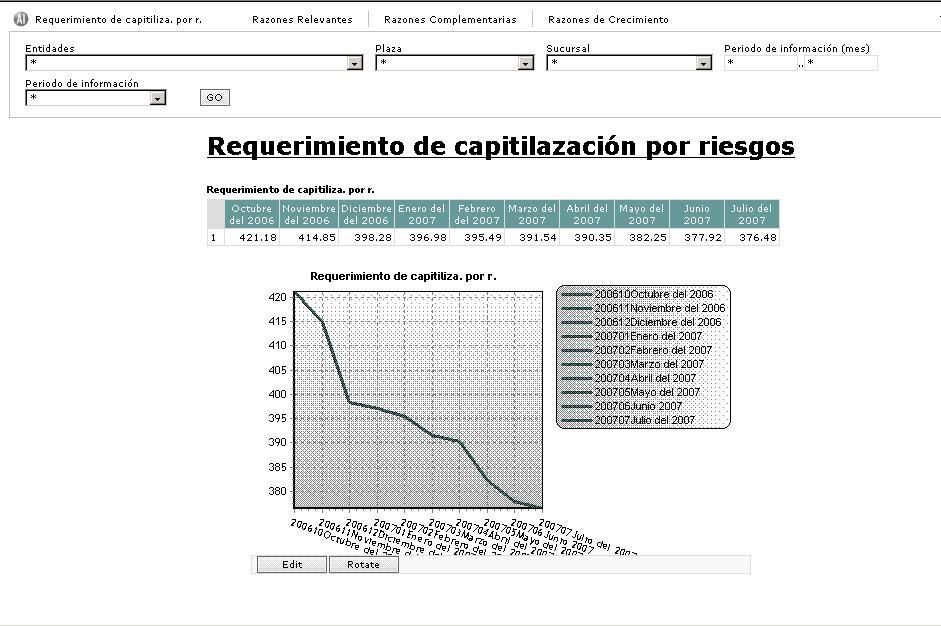
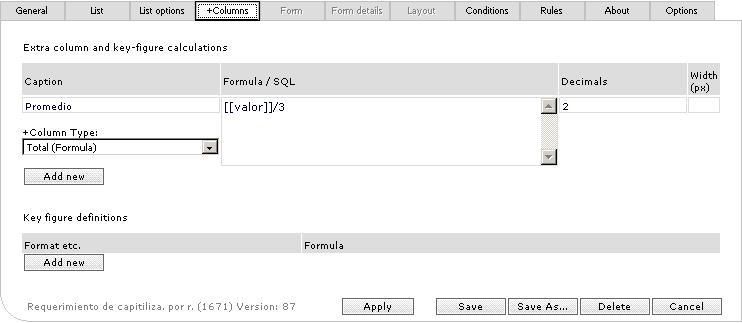
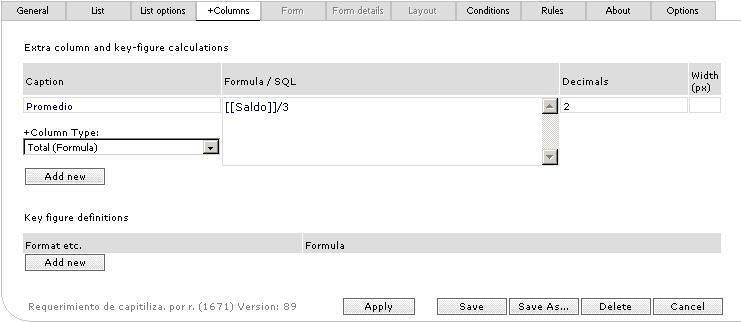
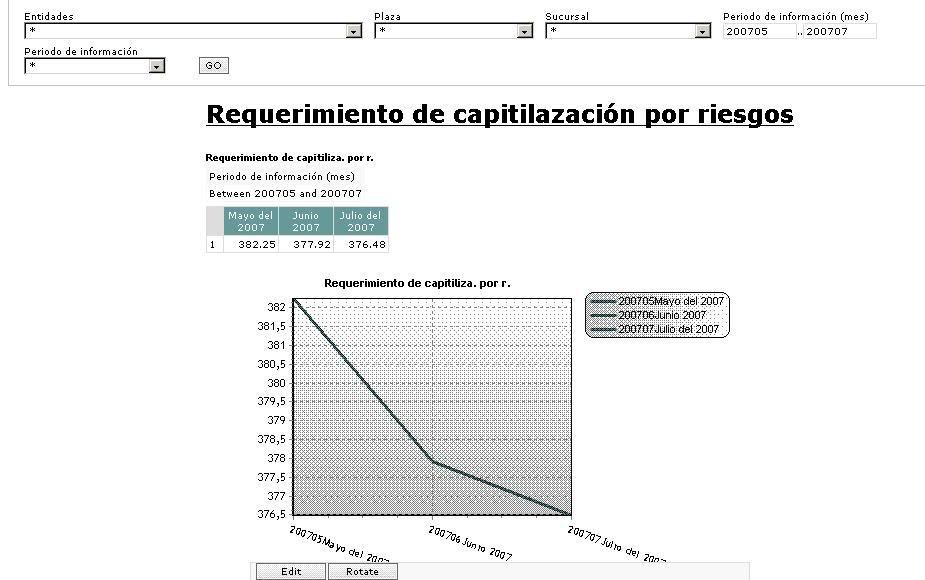
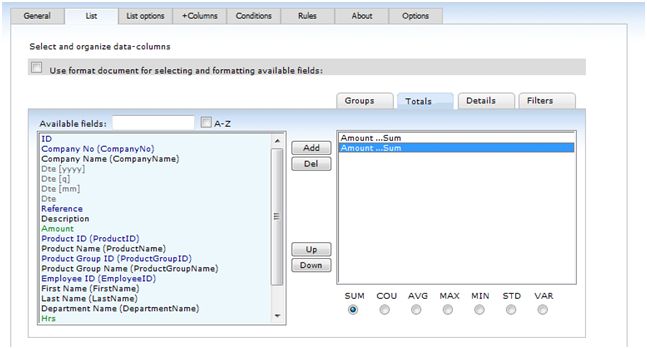
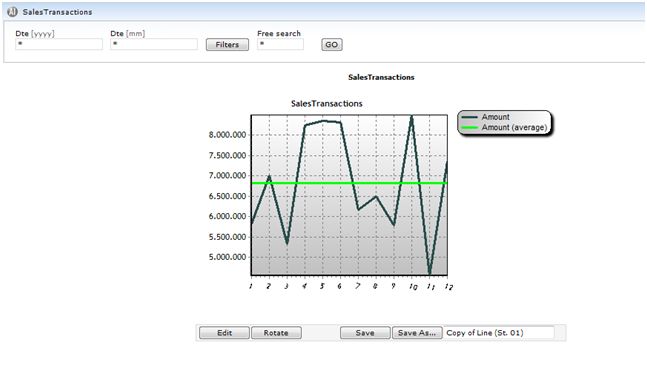
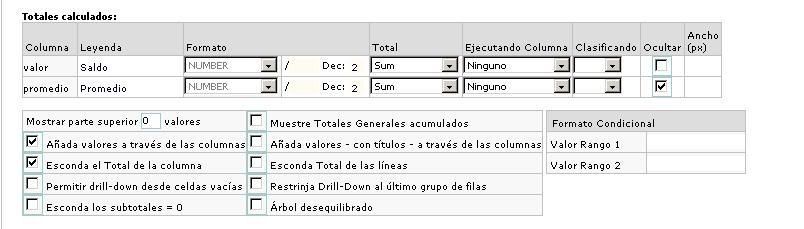
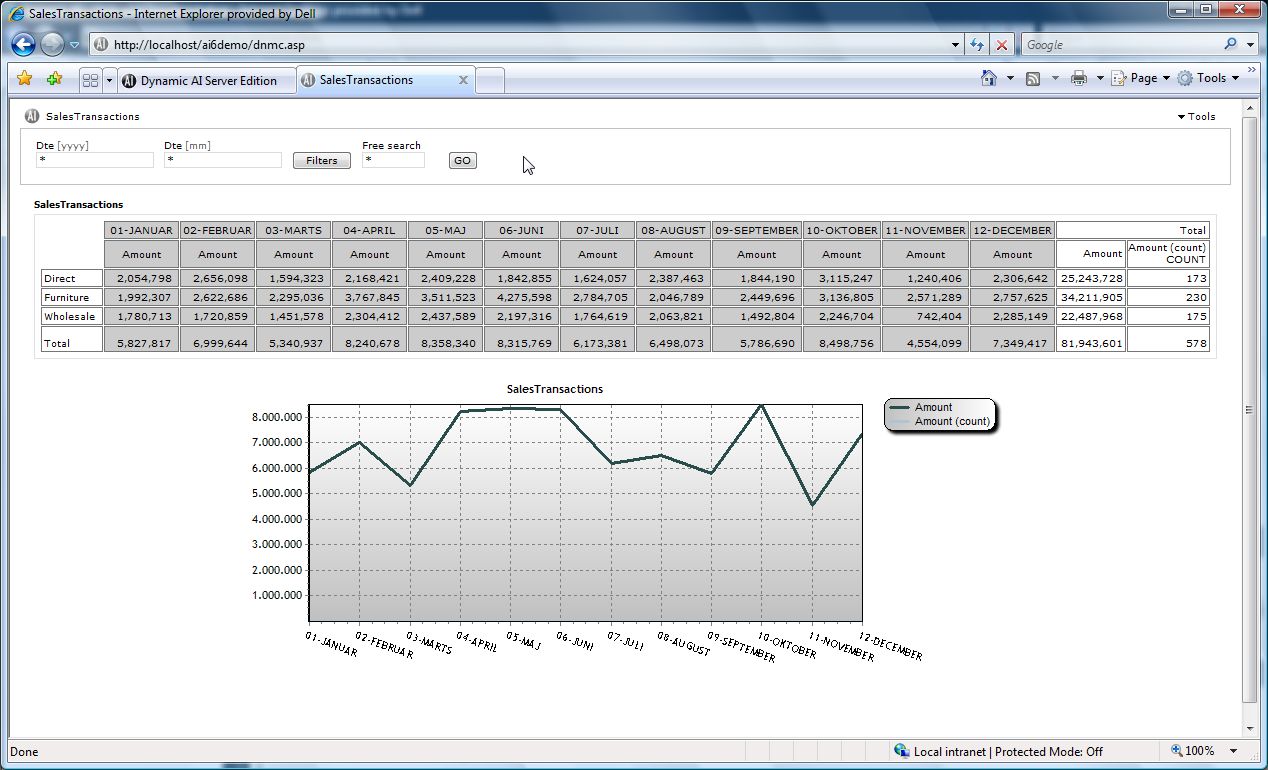
I have a problem with a "+ Columns" section. The query don't show extra column, perhaps because is a subquery.
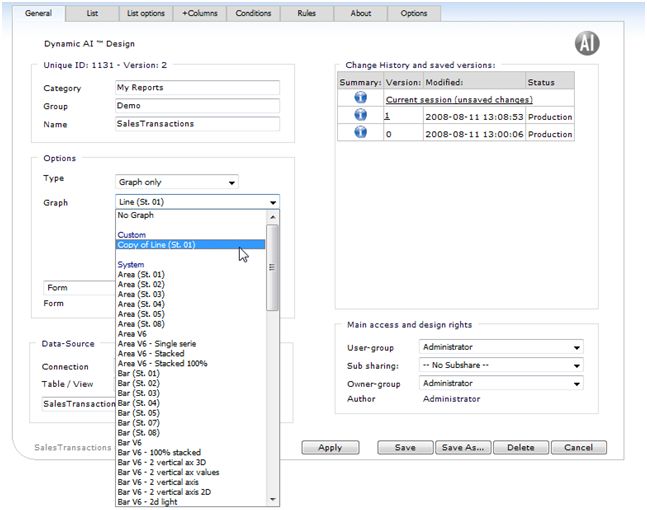
The report is based on Dynamic View
- Code: Select all
SELECT repindi.*, CONCAT (repindi.periodo, detvali.descripcion) AS fecha FROM repindi INNER JOIN detvali ON repindi.periodo=detvali.dato WHERE (repindi.cve_grupo = 1) AND (repindi.cve_indica = 1)
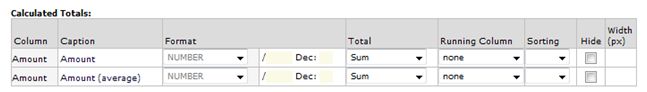
In "Extra column and key-figure calculations" section, I give the next query
- Code: Select all
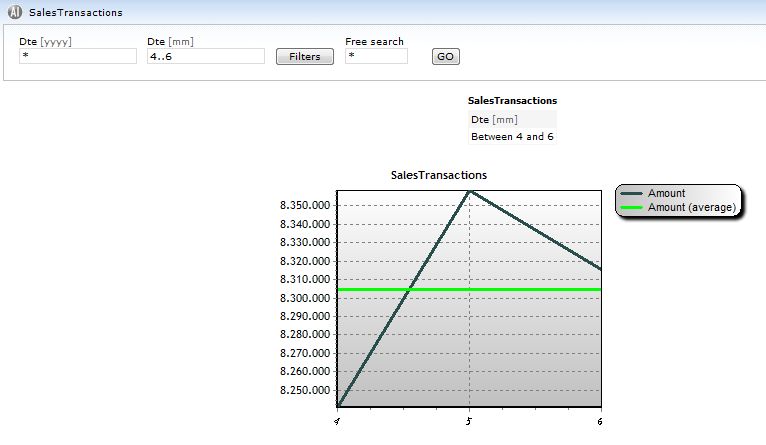
SELECT SUM(repindi.valor)/3 FROM repindi WHERE repindi.periodo BETWEEN 200705 AND 200707
Best Regards