The charting component has the ability to make radar charts, the challenge is how to populate.
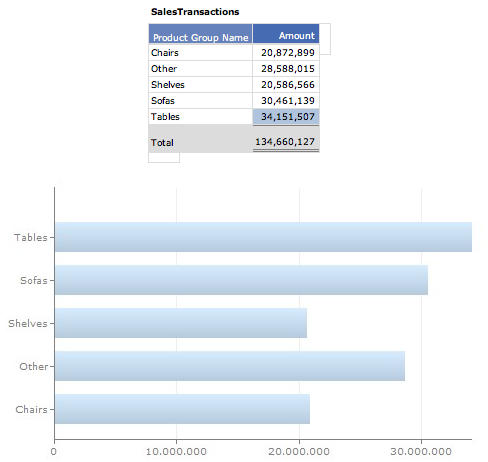
Usually, the source for a chart is either a list having a title and a value
like:

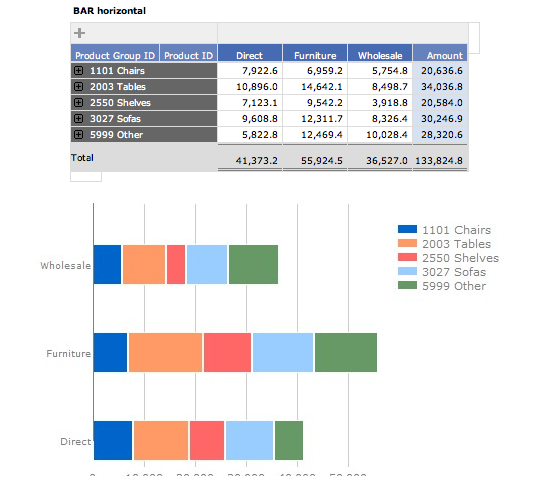
or a pivot list that has an extra dimension like:

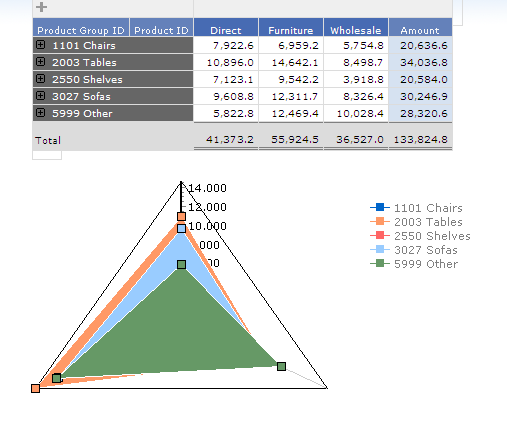
The radar chart that you show, would probably fit with the data from a pivot with 6 column groups and 3 row groups. You could try to edit your chart (you have to use IE since the editor is an activeX control)
my first result was:

Please share your results

Best regards
Bo


